I am learning flutter from JustAcademy, They provide very much great environment where people gather and work simultaneously. totally project based training institute.
MOHD ABU BAKAR ANSARI
Flutter Developer
Awesome Experience. I am a Front-end Web Designer working at Star India for 3 years now. I applied for Full-stack development and my experience has been phenomenal & they really do help with placements exceptionally. Thank you Roshan sir so much.
A practical guide to building data analyst skills, learning the right tools, creating projects, and starting a data analytics career without a technical degree.
For many people, becoming a data analyst sounds like a career reserved for computer science graduates, programmers, engineers, or people who have been working with numbers for years. But the reality is much broader. If you are wondering how can I become a data analyst without a technical background, the answer starts with understanding what the profession actually requires. You do not need to become a software developer before entering analytics. You need to develop the ability to work with data, understand business problems, use the right tools, and communicate meaningful insights clearly.
If you are considering a structured data analytics course to build those skills in a logical sequence, you can start by understanding the curriculum and practical areas covered. If you are still unsure whether data analytics is the right career direction for you, you can also book a Free Demo and understand the learning approach before making a decision.
The interesting thing about analytics is that your existing background does not necessarily become irrelevant. A marketing professional already understands campaigns and customers. Someone from finance understands revenue, costs, margins, and financial performance. A person from sales understands conversion, customer behavior, and targets. Someone from operations understands processes and efficiency. These experiences can become useful when you start working with data.
What you are adding is a new layer of technical and analytical capability that allows you to investigate business questions with evidence rather than assumptions.
Data has become part of almost every modern business decision. Companies use information to understand customers, monitor sales, evaluate marketing campaigns, forecast demand, measure employee performance, identify operational problems, and improve products. Yet raw data does not explain anything by itself. Someone has to transform it into information that decision makers can understand.
That person may be a data analyst.
The journey into this career does not require you to know everything from day one. It requires a sensible learning strategy. You need to understand spreadsheets, SQL, statistics, data visualization, business intelligence, and eventually Python or other analytical technologies. You need to practice these skills on realistic datasets. Most importantly, you need to learn how to think about data rather than simply operate software.
This guide explains how to build that foundation in 2026, what skills employers are looking for, which tools are worth learning, how to create projects without professional experience, what qualifications matter, and how to move from beginner to job ready data analyst.
Can You Become a Data Analyst Without a Technical Background?
The short answer is yes.
But it is important to define what “without a technical background” actually means.
It does not mean you can avoid technical skills completely. Data analysis is still a technical profession. You will eventually need to work with databases, spreadsheets, visualization platforms, statistics, and possibly programming.
What it means is that you do not have to arrive with those skills already mastered.
Your Previous Career Can Become an Advantage
Career changers often make the mistake of thinking their previous experience has no value.
Imagine someone who has worked in digital marketing for three years. They already understand customer acquisition, conversion rates, advertising channels, and marketing metrics. If that person learns SQL, Excel, Power BI, and statistics, they can position themselves toward marketing analytics.
Similarly:
A finance professional can move toward financial analytics.
A sales professional can explore sales analytics.
A marketing professional can specialize in marketing analytics.
An operations professional can move toward operational reporting.
A commerce graduate can combine business knowledge with analytics skills.
A management graduate can explore business intelligence and business analytics.
A fresher can build practical experience through projects and structured training.
You are not necessarily starting from zero.
You are transferring what you already know into a more data driven role.
What Does a Data Analyst Actually Do?
The data analyst role can look different across companies, but the central responsibility remains consistent.
An analyst takes information from one or more sources and turns it into useful insight.
Typical responsibilities may include:
Collecting data from spreadsheets, databases, applications, or business systems.
Cleaning inaccurate, duplicated, or incomplete records.
Writing SQL queries to retrieve relevant information.
Performing calculations and statistical analysis.
Identifying trends, relationships, and unusual patterns.
Building reports and interactive dashboards.
Presenting findings to managers and stakeholders.
Supporting data driven decision making.
Recommending areas that deserve further investigation.
Consider a company that notices its monthly revenue has decreased.
A beginner might simply report that revenue is down.
An analyst should investigate further.
Which products are responsible?
Which locations have changed?
Did customer volume decline?
Did average order value fall?
Did discounts increase?
Did a particular marketing channel perform poorly?
Was the change seasonal?
The value of an analyst comes from moving beyond the number and understanding the reason behind it.
Data Analysis Is Not Just About Coding
This is particularly important for people from non technical backgrounds.
Data analyst coding exists, but analytics is not the same as software development.
SQL is used to retrieve and manipulate information from databases. Python can be used for data processing, automation, and advanced analysis. But these tools support a larger analytical process.
You still need to understand the business problem.
You need to decide which metrics matter.
You need to question unusual results.
You need to interpret the numbers.
You need to communicate your conclusion.
That combination of technical knowledge and analytical thinking is what creates a strong data analytics skill set.
What Skills Do You Need to Become a Data Analyst in 2026?
If you search for the skills needed for a data analyst, you will find long lists containing dozens of technologies.
Do not let those lists overwhelm you.
For an aspiring analyst, the foundation can be built around a smaller set of core abilities.
You need to become comfortable working with structured information, querying data, understanding basic statistics, creating visualizations, and explaining business insights.
Excel for Data Analysts
Excel is still one of the most practical starting points.
It allows beginners to understand how datasets work without immediately introducing programming.
You should learn:
Formulas and functions.
Sorting and filtering.
Conditional logic.
Lookup functions.
Pivot tables.
Data cleaning.
Basic charts.
Data validation.
Basic reporting.
But do not treat Excel as a collection of formulas to memorize.
Use it to answer questions.
Take a sales dataset and determine:
Which products generate the highest revenue?
Which region has the strongest performance?
Which month generated the highest sales?
Which products have declining demand?
What is the average order value?
Which customer segment contributes most to revenue?
These exercises develop basic data analysis skills.
They also teach an important habit that remains useful even after you move to more advanced tools: always understand what the numbers represent.
SQL for Data Analysts
SQL is one of the most important skills you can develop if you want to work with business data.
Companies frequently store information inside relational databases. Customer records, transactions, product details, employee information, orders, and other operational data may all exist in different tables.
SQL allows analysts to retrieve and combine that information.
A sensible learning progression includes:
SELECT statements.
WHERE conditions.
ORDER BY.
GROUP BY.
Aggregate functions.
INNER and OUTER JOIN operations.
Subqueries.
Common table expressions.
CASE statements.
Window functions.
Data filtering and transformation.
The objective is not to memorize hundreds of commands.
The objective is to translate business questions into queries.
For example, if a manager asks which customer segment generated the highest revenue last quarter, you need to identify the relevant tables, connect the information correctly, aggregate the data, and interpret the result.
That is where SQL and data analysis meet.
Statistics for Data Analysts
Statistics is another area that beginners sometimes avoid because they associate it with complicated mathematics.
You do not need advanced mathematics to begin.
You should understand:
Mean, median, and mode.
Range and variance.
Standard deviation.
Percentages and ratios.
Distributions.
Correlation.
Basic probability.
Sampling.
Outliers.
Basic hypothesis testing concepts.
Statistics helps you avoid misleading conclusions.
Suppose one marketing campaign appears to have a higher conversion rate than another. Is the difference meaningful? Is the sample large enough? Could the result be influenced by another variable?
These questions require statistical thinking.
A good analyst does not simply observe a pattern.
A good analyst asks whether the pattern deserves to be trusted.
Which Data Analytics Tools Should You Learn?
The number of available data analytics softwares can make the industry look much more complicated than it is.
There are visualization platforms, database systems, spreadsheet tools, statistical analysis softwares, cloud platforms, automation tools, programming libraries, and specialized analytics products.
You do not need to learn everything.
A strong beginner stack can include:
Excel.
SQL.
Power BI or Tableau.
Statistics.
Python.
Basic business intelligence concepts.
Power BI for Business Intelligence
Power BI is particularly useful for analysts who want to work with reporting, dashboards, business intelligence, and data visualization.
You can use it to:
Connect datasets.
Transform information.
Create relationships between tables.
Build calculated measures.
Create interactive reports.
Track business KPIs.
Present trends visually.
For example, a company might use Power BI to monitor sales performance, employee metrics, marketing results, inventory, or financial KPIs.
The important skill is not knowing how to create attractive charts.
It is knowing which information deserves to be displayed.
For learners who want focused practical exposure, Microsoft Power BI Training in Mumbai provides a dedicated route for learning dashboards, reporting, visualization, and practical data analysis.
Tableau for Data Visualization
Tableau is another major platform used for data visualization and business reporting.
A Tableau data analyst may work with:
Interactive dashboards.
Calculated fields.
Filters.
Parameters.
Data blending.
Visual analysis.
Business reporting.
Data storytelling.
Tableau can be particularly useful for people who enjoy exploring patterns visually and communicating findings through interactive dashboards.
You do not necessarily need to learn Tableau and Power BI simultaneously.
Choose one as your primary visualization platform, become confident with it, and then learn the second tool when you have a clear reason to do so.
For learners interested in developing Tableau skills, Tableau Training in Mumbai is another structured learning option.
Python for Data Analysts
Python becomes useful when you want to move beyond traditional spreadsheet and dashboard workflows.
Python for data analysts commonly involves libraries such as pandas and NumPy for data manipulation and Matplotlib for visualization.
Python can help you:
Clean datasets.
Handle missing values.
Transform data.
Perform exploratory analysis.
Automate repetitive processes.
Work with larger datasets.
Build repeatable analytical workflows.
If programming is completely new to you, do not begin by trying to learn every aspect of software development.
Focus on Python concepts that support your analytical work.
A structured Python Training in Mumbai can be useful for learners who want to develop programming fundamentals before applying Python to data analysis.
Practical Data Analytics Tools Comparison
Tool
Primary Purpose
Beginner Priority
Typical Use
Excel
Spreadsheet analysis
Very High
Cleaning, calculations, reporting
SQL
Database querying
Very High
Data extraction and analysis
Power BI
Business intelligence
Very High
Dashboards and reporting
Tableau
Data visualization
High
Interactive visual analysis
Python
Advanced data analysis
High
Automation and data processing
Statistics
Analytical interpretation
Very High
Understanding patterns and uncertainty
The important lesson is simple.
Depth is more useful than collecting tool names.
Someone who understands SQL, Excel, Power BI, statistics, and business communication can be considerably stronger than someone who lists ten tools but cannot explain a single analysis.
How to Build a Data Analyst Roadmap for Beginners
One of the biggest problems beginners face is not a lack of information.
It is too much information.
You can find thousands of videos about SQL, Python, Power BI, Tableau, Excel, machine learning, artificial intelligence, cloud computing, and statistics.
Without a sequence, learning becomes chaotic.
A practical data analyst roadmap for beginners should move from foundational skills toward increasingly realistic business problems.
Stage One: Build Your Analytical Foundation
Start with:
Excel fundamentals.
Basic data cleaning.
Descriptive statistics.
Data types.
Basic visualization.
Analytical thinking.
The objective is to become comfortable looking at a dataset and understanding what it represents.
Stage Two: Learn SQL
Once you understand data at a basic level, learn SQL.
Focus on:
Querying.
Filtering.
Sorting.
Aggregation.
Joins.
Subqueries.
Common table expressions.
Window functions.
Start solving business questions instead of completing syntax exercises only.
Stage Three: Learn Business Intelligence
Choose Power BI or Tableau.
Learn how to:
Import data.
Clean and transform data.
Build relationships.
Create calculated metrics.
Build dashboards.
Select appropriate visualizations.
Present insights.
Stage Four: Add Python
After developing a foundation, add Python.
Learn the parts of Python that are useful for analytics:
Variables and data structures.
Functions.
pandas.
NumPy.
Data cleaning.
Exploratory data analysis.
Basic visualization.
Stage Five: Build Projects
Finally, combine your skills.
Create projects that answer real business questions.
The purpose of this roadmap is not to make you an expert in every technology.
It is to make you capable of taking a business question and working through the data from beginning to conclusion.
They learn several tools but still ask the same question:
“How do I get experience if nobody will hire me?”
The answer is to create evidence of practical ability before your first job.
You can do this through projects.
Build Projects Around Questions, Not Tools
Do not create a project simply because you want to put Power BI on your resume.
Start with a question.
For example:
Why are sales declining in one region?
Which products generate the highest profit?
Which customers are most valuable?
Which marketing channel produces the strongest conversion rate?
Which employee groups have the highest attrition?
Which products show seasonal demand?
A good project starts with curiosity.
The technology comes afterward.
Build a Data Analyst Portfolio
A strong beginner portfolio does not need twenty projects.
Three to five thoughtful projects can be enough to demonstrate your abilities.
Your portfolio could contain:
Project
Tools
Skills Demonstrated
Sales Analysis
Excel, SQL
Cleaning, aggregation, business analysis
Sales Dashboard
Power BI
Data modeling, visualization, reporting
Customer Analysis
Python, SQL
Data manipulation and analysis
Marketing Analysis
Excel, Power BI
Marketing analytics and data storytelling
Business Performance Dashboard
Tableau
Visualization and KPI reporting
Each project should explain the problem, dataset, cleaning process, analysis, visualizations, findings, and recommendations.
This creates a narrative that recruiters can understand.
Data Analyst Projects Should Demonstrate Business Thinking
Suppose your dashboard shows that revenue increased by 15 percent.
That is useful.
But what caused the increase?
Was it more customers?
Higher prices?
A particular product?
A new region?
A promotional campaign?
The deeper you investigate, the more valuable your project becomes.
This is the difference between creating a dashboard and performing data analysis.
What Makes a Strong Portfolio Project?
A good project should contain:
A clearly defined business problem.
A description of the dataset.
Data cleaning steps.
Exploratory analysis.
Relevant calculations.
Appropriate visualizations.
Important findings.
Business recommendations.
A short conclusion.
Avoid copying projects directly from tutorials.
Use tutorials to learn techniques, then apply those techniques to a different problem or dataset.
Understand Data Analytics Qualifications
One of the biggest concerns for career changers is education.
Do I need a computer science degree?
Do I need a statistics degree?
Do I need an engineering background?
There is no universal answer.
Different employers have different expectations.
What Qualifications for Data Analyst Roles Matter?
Data analytics qualifications can take different forms.
They may include:
A bachelor's degree.
Relevant academic coursework.
Professional certifications.
Structured data analytics training.
Practical projects.
Internships.
Relevant work experience.
A strong portfolio.
A degree in computer science, mathematics, statistics, economics, engineering, finance, commerce, or business can provide useful foundations.
But your degree does not automatically determine whether you can become an analyst.
Practical capability matters.
Data Analyst Job Qualifications for Career Changers
If your degree is unrelated, your transition story needs to be clear.
Suppose your background is in marketing.
Instead of saying:
“I changed careers because I wanted something different.”
You can demonstrate:
Experience understanding marketing metrics.
Knowledge of customer behavior.
SQL skills.
Power BI dashboards.
Marketing analytics projects.
Data interpretation ability.
Now your transition has a logical connection.
Your previous experience becomes part of your advantage.
Develop Business Analytics Skills
Technical ability is only one side of the profession.
The other side is business understanding.
A company does not hire an analyst simply because the analyst knows SQL.
The company wants better decisions.
Understand Data Driven Decision Making
Data driven decision making means using evidence to guide decisions instead of relying entirely on assumptions or intuition.
Suppose a retailer wants to open another store.
An analyst might examine:
Customer demand.
Existing sales.
Demographic patterns.
Competitor presence.
Location performance.
Purchasing behavior.
Seasonal trends.
The analyst does not necessarily make every strategic decision.
Instead, the analyst provides evidence that helps decision makers evaluate their options.
Learn to Ask Better Questions
The quality of an analysis depends heavily on the quality of the question.
“Show me sales” is vague.
“Which product categories contributed most to the decline in gross margin during the last two quarters?” is much more useful.
Good analysts learn to clarify:
What does success mean?
Which period are we analyzing?
Which customer group matters?
What metric should we measure?
What decision will this analysis support?
What information is missing?
This habit can dramatically improve your work.
Business Intelligence Is About More Than Reports
Business intelligence brings together data, technology, reporting, and decision making.
Tools such as Power BI and Tableau help organizations see information more clearly.
But the analyst still needs to understand what the business cares about.
A dashboard should answer questions.
It should not simply occupy a screen.
Learn Data Visualization and Data Storytelling
Data visualization is one of the most visible parts of analytics.
But visualization is not decoration.
It is communication.
Choose the Right Visual
Different questions require different visuals.
Business Question
Suitable Visual
How have sales changed over time?
Line chart
Which product performs best?
Bar chart
How are categories distributed?
Bar or column chart
Is there a relationship between two variables?
Scatter plot
How are KPIs performing?
KPI cards
How do regions compare?
Map or bar chart
How does performance change across segments?
Stacked or grouped chart
The choice should depend on the analytical message.
Data Storytelling Makes Analysis More Valuable
Imagine presenting a dashboard to a senior manager.
You could say:
“Here are twelve charts.”
Or you could say:
“Revenue increased overall, but profit declined because discounting increased in two major product categories. Those categories account for most of the margin reduction.”
The second explanation is much more useful.
That is data storytelling.
Your role is not simply to show numbers.
Your role is to explain what the numbers mean.
Prepare for Data Analyst Jobs in India
Once your technical foundation is strong enough, start preparing for the hiring process.
Data analyst jobs in India exist across many sectors, including:
IT services.
Consulting.
Banking.
Ecommerce.
Healthcare.
Manufacturing.
Retail.
Logistics.
Marketing.
Financial services.
Technology startups.
The job title may not always be identical.
You might see:
Junior Data Analyst.
Reporting Analyst.
Business Intelligence Analyst.
Business Analyst.
Marketing Analyst.
Product Analyst.
Operations Analyst.
Data Analyst.
Understand Data Analyst Job Requirements
Typical data analyst job requirements may include:
Excel.
SQL.
Power BI or Tableau.
Data cleaning.
Basic statistics.
Reporting.
Data visualization.
Business analysis.
Communication.
Problem solving.
Some positions require Python.
Others may emphasize Excel and Power BI.
Some roles may be closer to business analysis, while others involve deeper technical work.
Read job descriptions carefully.
Instead of asking whether you match every requirement, identify recurring requirements across multiple job postings.
Those recurring skills should become your learning priorities.
Build a Resume Around Evidence
A weak resume says:
“Knowledge of Power BI, SQL and Python.”
A stronger resume explains what you did.
For example:
“Created an interactive sales dashboard to analyze regional revenue, product performance, customer segments and monthly trends.”
The second statement gives the recruiter something concrete to evaluate.
Your resume should demonstrate outcomes rather than simply list software names.
Prepare to Explain Your Projects
Every project on your resume should be something you can discuss confidently.
Be ready to answer:
Why did you choose this dataset?
What was the business problem?
How did you clean the data?
Which SQL queries did you write?
Why did you choose those visualizations?
What did you discover?
What would you recommend?
What limitations did your analysis have?
These questions are more important than memorizing definitions.
What Skills Are Required for a Data Analyst Fresher?
Freshers sometimes worry that they need to compete with experienced professionals.
You are not expected to know everything.
The skills required for data analyst fresher roles are generally centered around foundational technical ability and problem solving.
Technical Skills
Focus on:
Excel.
SQL.
Statistics.
Power BI or Tableau.
Basic Python.
Data cleaning.
Data visualization.
Analytical Skills
Develop your ability to:
Identify patterns.
Compare groups.
Investigate unusual results.
Question assumptions.
Interpret trends.
Draw reasonable conclusions.
Communication Skills
Practice explaining technical findings in simple language.
You should be able to explain your project to someone who does not know SQL, Python, Power BI, or Tableau.
Business Skills
Learn to connect metrics with business questions.
Together, these become your data analyst key skills.
How to Start Your Data Analyst Career in India
Starting a data analyst career in India is less about having a perfect technical background and more about building demonstrable skills that match what employers actually need. Once you have a foundation in Excel, SQL, statistics, data visualization, and at least one business intelligence platform, the next step is to turn those skills into evidence that recruiters can evaluate.
Build a Job Ready Skill Set
Before applying for jobs, make sure you are comfortable with the fundamentals:
Excel: Data cleaning, formulas, pivot tables, lookups, and reporting.
SQL: Filtering, joins, aggregation, subqueries, CTEs, and window functions.
Power BI or Tableau: Dashboard development, visualization, data modeling, and KPI reporting.
Statistics: Descriptive statistics, distributions, correlation, and basic analytical concepts.
Python: pandas, NumPy, data cleaning, exploratory analysis, and basic visualization.
Business analysis: Understanding KPIs, identifying trends, and connecting findings with business decisions.
You do not have to master every skill before applying. However, you should be able to demonstrate how you have used these skills in practical situations.
Target the Right Entry Level Roles
Do not search only for the exact title “Data Analyst.” Companies use different titles for similar analytical responsibilities.
You can also look for:
Junior Data Analyst
Business Intelligence Analyst
Reporting Analyst
Business Analyst
Marketing Analyst
Operations Analyst
Product Analyst
MIS Analyst
Data Reporting Analyst
Reading multiple job descriptions can help you identify the skills that appear repeatedly across the market.
Create a Portfolio Before You Apply
Your portfolio can compensate for the lack of professional analytics experience by demonstrating what you can actually do.
Include projects that show:
Data cleaning
SQL analysis
Dashboard creation
Business problem solving
Data visualization
Statistical interpretation
Business recommendations
For example, instead of simply writing “Power BI project” on your resume, explain the problem you solved, the dataset you analyzed, the KPIs you created, and the insight you discovered.
Prepare for Data Analyst Interviews
Once you start applying, interview preparation becomes important.
Expect questions around:
SQL queries
Excel functions
Data cleaning
Statistics
Power BI or Tableau
Business case studies
Data interpretation
Your portfolio projects
You should also be able to explain your projects without relying on technical jargon. An interviewer may be more interested in why you selected a particular approach than whether you can simply remember a formula or command.
Use Structured Training and Placement Support Strategically
For someone transitioning from a non technical background, structured training can shorten the gap between learning individual tools and becoming job ready. A program that combines live interactive sessions, practical projects, interview preparation, portfolio development, and placement support can provide a clearer path toward entry level opportunities.
The important point is that training should complement your own practice. You still need to work with datasets, solve problems independently, build projects, and develop the confidence to discuss your analysis.
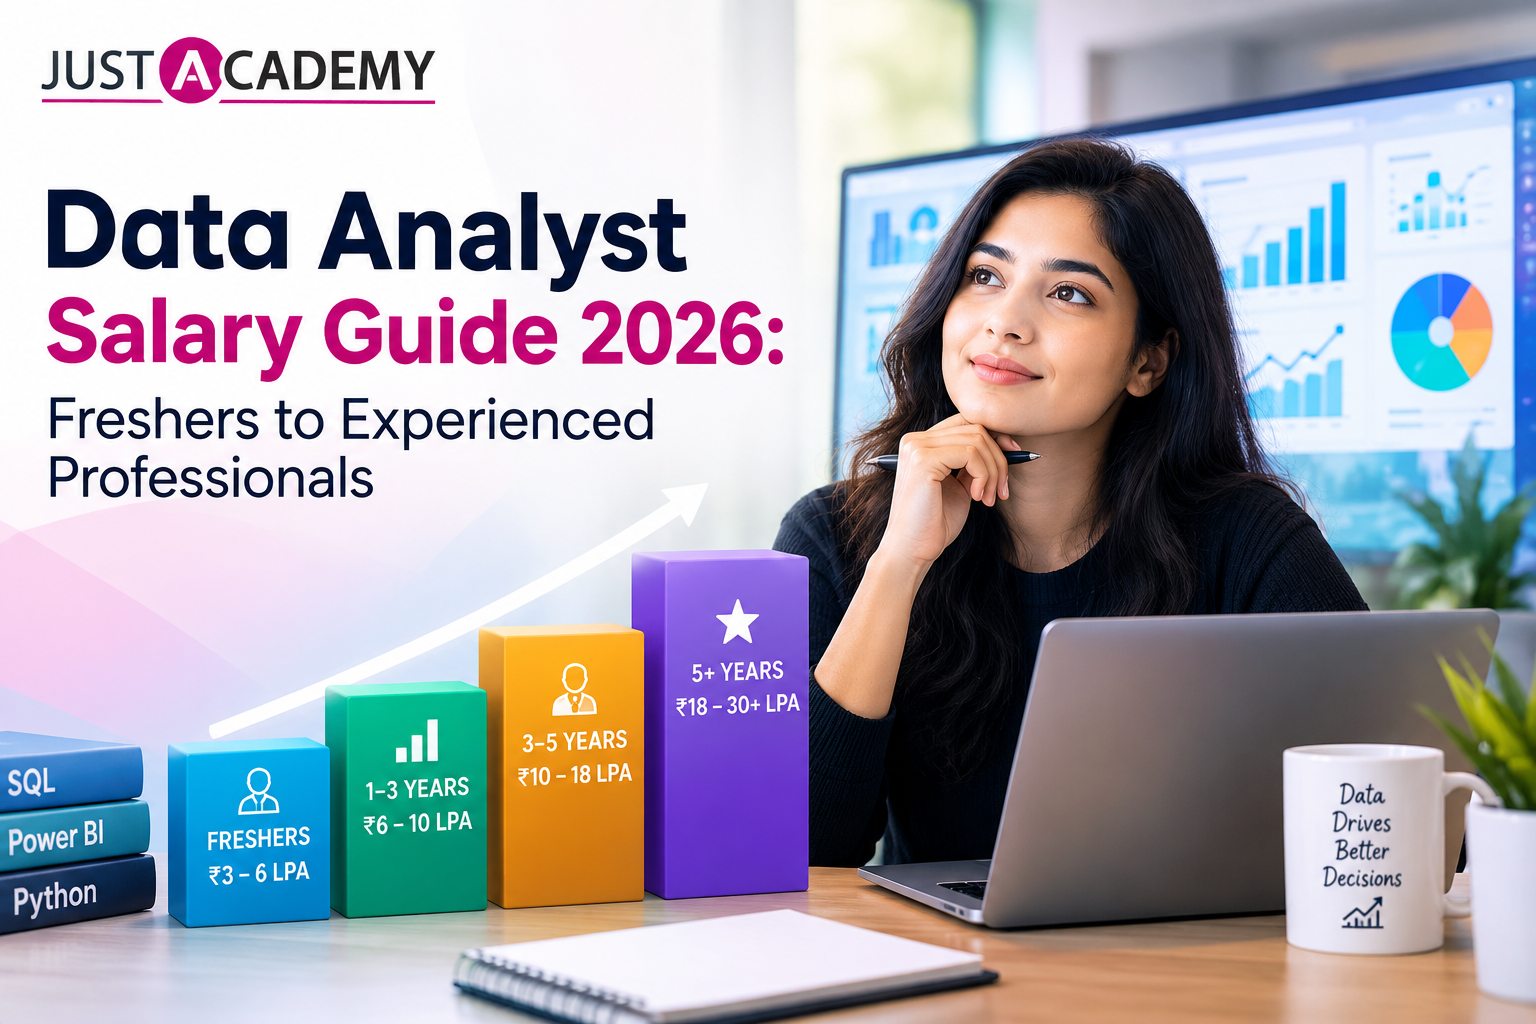
What About Data Analyst Salary in India?
Data analyst salary in India varies according to:
Experience.
Location.
Industry.
Company.
Technical skills.
Educational background.
Specialization.
Business knowledge.
A fresher will naturally enter at a different level from someone with several years of analytics experience.
Instead of focusing only on a salary number, think about the skills that increase your long term value.
SQL expertise can open opportunities.
Strong business intelligence skills can create another path.
Python can expand your analytical capabilities.
Industry knowledge can make you more valuable.
Communication and stakeholder management can help you progress into senior roles.
Your first data analyst job is the beginning of your professional learning curve.
Career Growth After Your First Data Analyst Role
With experience, you can move into positions such as:
Senior Data Analyst.
Business Intelligence Analyst.
Product Analyst.
Marketing Analyst.
Analytics Consultant.
Business Analyst.
Analytics Engineer.
Data Scientist, with additional specialization.
The direction depends on what you enjoy.
If you love dashboards, business intelligence may suit you.
If you enjoy customer behavior, product or marketing analytics may be attractive.
If you prefer technical problem solving, Python, advanced SQL, automation, and data engineering concepts may become more important.
Common Mistakes Beginners Should Avoid
Learning analytics can be exciting, but beginners can easily lose direction.
Trying to Learn Everything at Once
Do not attempt to learn:
Excel.
SQL.
Python.
Power BI.
Tableau.
Machine learning.
Cloud computing.
Artificial intelligence.
Advanced statistics.
all at the same time.
Build a core foundation first.
Treating Certificates as the Final Goal
A certificate can support your profile.
It cannot replace practical ability.
Your project portfolio should demonstrate what you can actually do.
Copying Projects From Tutorials
Tutorials are useful for learning.
But your portfolio should not simply reproduce someone else's dashboard.
Instead:
Change the dataset.
Ask a different question.
Perform your own analysis.
Create your own recommendations.
Explain your reasoning.
Ignoring Communication
An analyst who cannot explain their findings will struggle to create business value.
Practice explaining your analysis without technical jargon.
Imagine that your audience knows nothing about SQL or Python.
Can you still explain the insight?
If yes, you are developing an important professional skill.
How Structured Training Can Help Career Changers
Self learning is absolutely possible.
However, many beginners struggle with consistency and direction.
They watch one SQL tutorial, then jump to Python, then start Power BI, then discover Tableau, and eventually become confused about what to learn next.
Structured training can reduce this problem by giving you a sequence.
Live Interactive Sessions Provide Real Time Guidance
Live interactive sessions can be particularly useful when you are learning something unfamiliar.
You can ask questions while working through a problem instead of spending hours trying to understand why your query, calculation, or dashboard is not working.
A structured learning environment can provide:
Instructor guidance.
Doubt resolution.
Practical assignments.
Real world datasets.
Project based learning.
Interview preparation.
Portfolio guidance.
Career support.
Placement support.
Practical Projects Help Build Confidence
A structured program should give you opportunities to work with realistic problems.
JustAcademy's Data Analytics Bootcamp in Mumbai with real world projects covers areas including Excel analytics, SQL queries, Power BI, Python for data analysis, statistics, Tableau, data cleaning, data interpretation, and data visualization. The program also lists live instructor led sessions, projects, interview preparation, portfolio review, and job assistance.
This kind of structured approach can be particularly useful for beginners who want to move from learning individual tools to completing an end to end data analytics project.
Why Structured Training Matters for a Career Switch
Changing careers can be difficult because you are entering a field where many concepts are unfamiliar.
A structured environment can give you a clear progression.
Learning With a Defined Sequence
Instead of asking what to learn next every week, you can follow a curriculum that gradually moves from fundamentals to practical application.
This helps prevent knowledge gaps.
Getting Feedback on Your Work
Feedback can reveal problems that you may not notice yourself.
For example:
Your SQL query may work but could be inefficient.
Your dashboard may contain too many visuals.
Your analysis may be technically correct but fail to answer the business question.
Your recommendations may not be supported by the available data.
Professional feedback helps you improve these areas.
Building Job Readiness Alongside Technical Skills
A career focused program should not stop at classroom teaching.
Resume preparation, interview practice, portfolio guidance, project presentation, and placement support can help connect learning with the job search.
This can be particularly useful for freshers and career changers who may not know how employers evaluate entry level candidates.
A Practical 90 Day Learning Plan
You do not have to follow this exact timeline, but a structured 90 day approach can help you avoid random learning.
Period
Main Focus
Practical Goal
Days 1 to 30
Excel and statistics
Analyze small datasets confidently
Days 31 to 60
SQL
Solve business questions using databases
Days 61 to 75
Power BI or Tableau
Build interactive dashboards
Days 76 to 90
Projects and portfolio
Complete and document practical projects
First 30 Days
Focus on:
Excel.
Data cleaning.
Pivot tables.
Basic statistics.
Basic visualization.
Analytical thinking.
Use real datasets.
Do not simply watch videos.
Days 31 to 60
Focus heavily on SQL.
Practice:
Filtering.
Aggregation.
Joins.
Subqueries.
CTEs.
Window functions.
Start solving business questions.
Days 61 to 75
Choose Power BI or Tableau.
Build dashboards.
Practice:
Data preparation.
Data modeling.
Calculated metrics.
Visual selection.
Dashboard design.
Data storytelling.
Days 76 to 90
Combine your skills into projects.
Build at least two strong portfolio pieces.
Document:
The problem.
The dataset.
Your process.
Your analysis.
Your findings.
Your recommendations.
Python can then be introduced more deeply based on your career goals and current skill level.
What Should Your First Data Analyst Portfolio Contain?
A portfolio should make your transition believable.
It should answer one question for the recruiter:
“Can this person actually analyze data?”
Project One: Sales Analysis
Use Excel and SQL to analyze:
Product performance.
Regional sales.
Monthly trends.
Customer segments.
Revenue.
Profitability.
The objective should be to identify patterns and provide recommendations.
Project Two: Business Intelligence Dashboard
Create a Power BI or Tableau dashboard showing important KPIs.
Do not overload the dashboard.
Focus on useful information.
Project Three: Customer Analysis
Use Python or SQL to explore customer behavior.
Look for:
Purchasing patterns.
Repeat purchases.
Customer segments.
Churn indicators.
Revenue contribution.
Project Four: Marketing Analytics
Analyze campaign performance.
Compare:
Marketing channels.
Conversion rates.
Customer acquisition.
Campaign costs.
Revenue contribution.
This can be especially useful for someone transitioning from marketing.
A Simple Framework for Solving Any Analytics Problem
When you receive a new dataset, do not immediately start building charts.
Use a structured process.
Step 1: Define the Question
What decision are you trying to support?
Step 2: Understand the Data
Ask:
What does each column mean?
Where did the data come from?
How recent is it?
Are there missing values?
Are there duplicate records?
Step 3: Clean the Dataset
Correct inconsistent formats.
Remove duplicates where appropriate.
Handle missing information carefully.
Step 4: Explore the Data
Look for:
Trends.
Relationships.
Outliers.
Unexpected values.
Distribution patterns.
Step 5: Analyze
Use SQL, Excel, Python, Power BI, Tableau, or another appropriate tool.
Step 6: Visualize
Choose visuals that communicate the findings clearly.
Step 7: Interpret
Explain what the results actually mean.
Step 8: Recommend
Where appropriate, explain what the business could investigate or do next.
This framework can become one of the most useful habits in your career.
How to Stand Out as a Non Technical Candidate
Your biggest challenge may not be learning analytics.
It may be explaining why your background makes sense for analytics.
Do not apologize for your previous career.
Connect it.
Use Your Existing Experience
If you worked in marketing:
Show marketing analytics projects.
Analyze campaign performance.
Work with customer data.
Connect conversion metrics with business outcomes.
If you worked in finance:
Analyze revenue.
Study profitability.
Work with financial KPIs.
Build financial dashboards.
If you worked in operations:
Analyze process performance.
Study efficiency.
Examine inventory or logistics data.
Identify operational bottlenecks.
If you are a fresher:
Build realistic projects.
Document your learning.
Create a portfolio.
Practice business case questions.
Develop strong foundational skills.
Your transition becomes more believable when you show a logical connection between your previous experience and your new capabilities.
Is Data Analytics a Good Career Choice in 2026?
For people who enjoy working with information, solving problems, asking questions, and communicating insights, data analytics can be an attractive career direction.
It is also a field that intersects with many industries.
You do not have to work for a technology company.
Analysts are needed across:
Banking.
Retail.
Healthcare.
Manufacturing.
Logistics.
Ecommerce.
Marketing.
Finance.
Consulting.
Technology.
The domain can change while the analytical foundation remains useful.
The Future of the Data Analyst Role
The tools analysts use will continue to evolve.
Automation and artificial intelligence are changing how people work with data.
But that does not make analytical thinking irrelevant.
If anything, it makes the ability to ask the right question more important.
A tool can generate an output.
Someone still needs to decide whether the output makes sense.
Someone needs to understand the business context.
Someone needs to validate the result.
Someone needs to communicate the implication.
That is where human analytical judgment remains valuable.
Final Advice for Aspiring Data Analysts
If you are coming from a non technical background, do not spend months worrying about whether you are “qualified enough” to begin.
Start learning.
But learn strategically.
Focus on These Priorities
Learn Excel properly.
Build strong SQL fundamentals.
Understand statistics.
Choose Power BI or Tableau.
Learn Python progressively.
Create real data analyst projects.
Build a professional portfolio.
Practice explaining your findings.
Prepare for technical interviews.
Understand business problems.
Apply for relevant entry level roles.
Do not chase every trending technology.
Build a foundation.
The first SQL query may look confusing.
The first Power BI dashboard may look messy.
The first Python script may contain errors.
Your first project may not be impressive.
None of that means you cannot become a data analyst.
It means you are learning.
Conclusion
Learning how to become a data analyst in 2026 without a technical background is not about finding a shortcut around technical skills. It is about learning those skills in the right order and connecting them to real business problems.
You do not need to know every analytics platform.
You do not need to become an expert programmer.
You do not necessarily need a computer science degree.
You need a strong foundation in data analysis, SQL, spreadsheets, statistics, visualization, business intelligence, and eventually Python. You also need practical projects that demonstrate your ability to turn raw information into meaningful conclusions.
Your previous professional background can become part of that story rather than something you need to hide.
If you are a marketing professional, use your marketing knowledge.
If you come from finance, use your financial knowledge.
If you come from operations, use your understanding of processes.
If you are a fresher, build your experience through projects and structured practice.
If you are specifically interested in Power BI as a career skill, the Power BI Developer Roadmap 2026 can help you understand the skills involved in developing your Power BI career.
For learners who prefer structured education, JustAcademy offers Mumbai classroom training and global online learning options with live interactive sessions, practical projects, career guidance, and placement support.
The goal is not to become perfect before applying for jobs.
The goal is to become capable enough to solve real problems, explain your reasoning, and continue learning once you enter the profession.
If you are ready to explore structured learning, you can review the Data Analytics course, understand the available learning options, and speak with the training team.
If you want to experience the learning approach before making a decision, register for a Free Demo.
You can also review the JustAcademy Brochure to understand the broader course and training options.
The data analytics career path may look complicated when you see all the tools and job requirements together.
Break it into smaller steps.
Learn one skill.
Work with one dataset.
Answer one business question.
Build one useful project.
Then repeat.
That is how a career transition becomes a realistic plan rather than just an idea.
Can You Become a Data Analyst Without a Technical Background?
What Skills Do You Need to Become a Data Analyst in 2026?What Skills Do You Need to Become a Data Analyst in 2026?
How to Build Data Analyst Skills Without Prior ExperienceHow to Build Data Analyst Skills Without Prior Experience
A straight talking guide for Delhi learners on what mobile app developers really earn, which skills raise the number, and how live, mentor led training can shorten the road from beginner to hired.
A practical guide for Delhi learners covering react native app ideas for beginners, live mentor led practice, and a portfolio that actually gets interviews
A practical, honest walkthrough of Swift, Xcode, Windows workarounds, Flutter, React Native and the career paths that open up once you can build for Apple devices
A practical, no nonsense guide to software jobs for freshers, from picking a skill path to cracking interviews and aiming at the highest paying software engineering jobs
40 real questions and detailed answers on Kotlin, Jetpack, architecture, performance and security, so you walk into your next android technical interview ready to talk like a working developer.
From your first line of JavaScript to a react native app on the Play Store and App Store, here is the honest, practical route that beginners in India can actually follow.
Drop us a Query
+91 99871 84296
Available 24x7 for your queries
Want To Connect with us
🚀 Kickstart Your IT Career
with JustAcademy
Learn Industry-Focused Courses with Live Projects & Placement Assistance
Full Stack Java(Java, Spring Boot, Hibernate, REST API, React JS)
Data Analytics(Excel, SQL, Power BI, Python, Tableau)