Advanced Excel amp Power BI Training Live Sessions with Placement AssistanceIf you are looking for a practical Advanced Excel amp Power BI Course to develop skills for Data Analytics Business Intelligence MIS reporting business reporting and dashboard development JustAcademy offers a structured Advanced Excel amp Power BI Training program focused
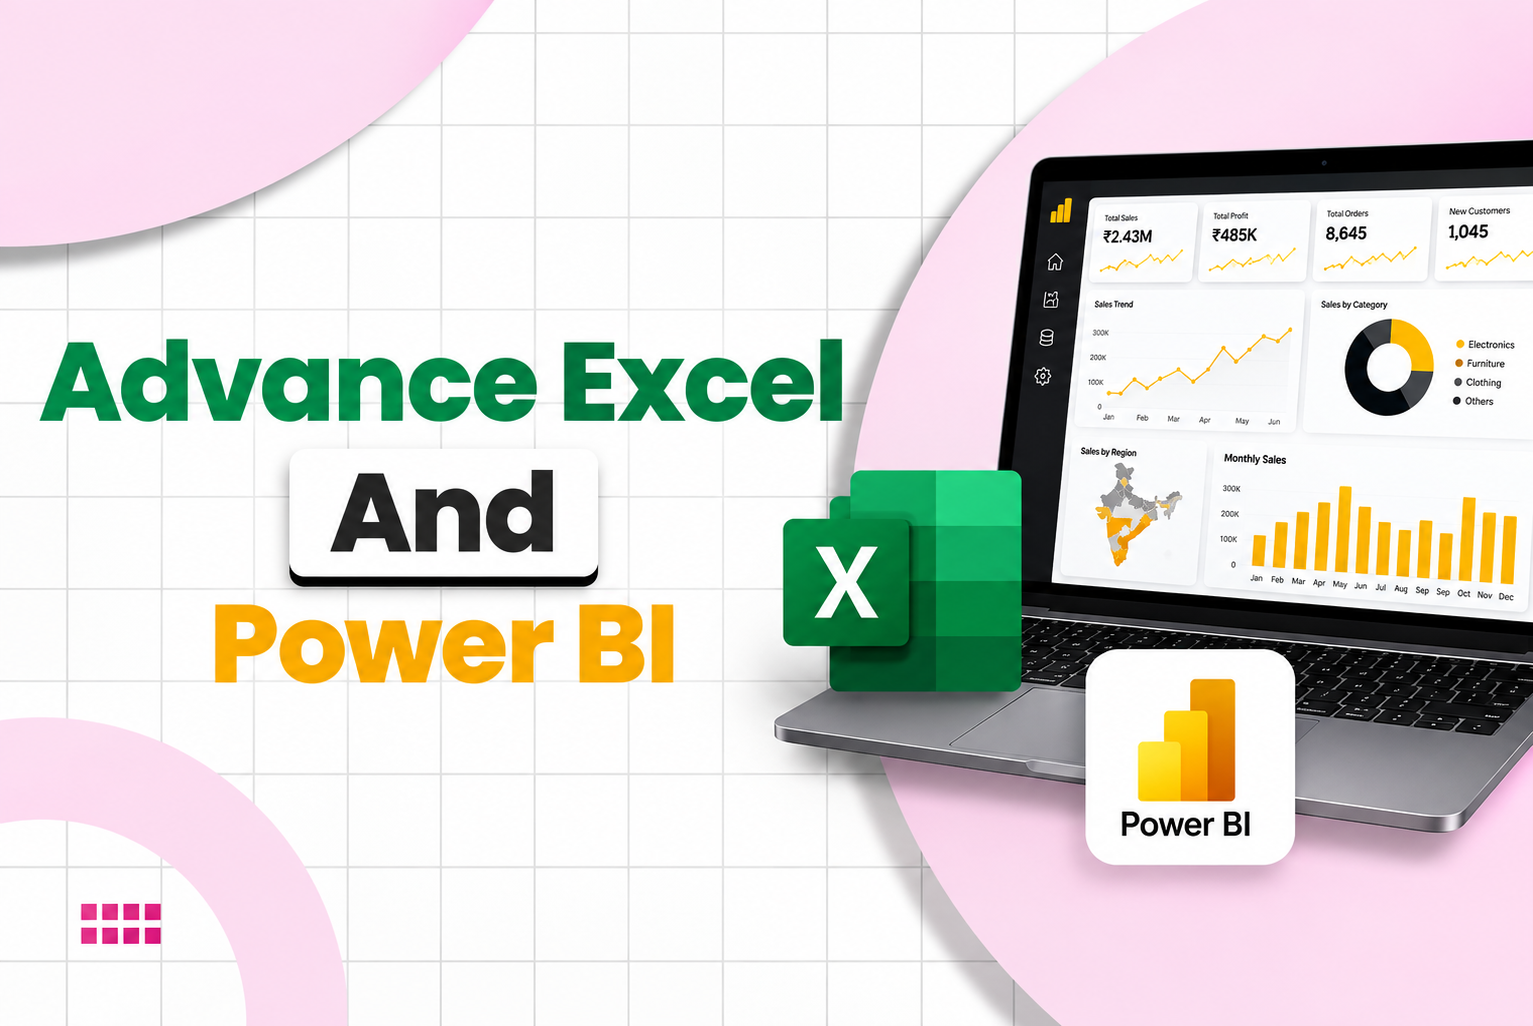
Advanced Excel & Power BI Training – Live Sessions with Placement Assistance
If you are looking for a practical Advanced Excel & Power BI Course to develop skills for Data Analytics, Business Intelligence, MIS reporting, business reporting, and dashboard development, JustAcademy offers a structured Advanced Excel & Power BI Training program focused on live learning, practical exercises, real-world datasets, projects, certification, and placement assistance.
The course is designed for students, fresh graduates, working professionals, MIS executives, finance professionals, sales professionals, operations professionals, business professionals, and learners planning to build a career in Data Analytics.
Excel remains an important tool for business reporting, calculations, data preparation, analysis, and operational reporting. Power BI extends these capabilities by allowing professionals to create interactive dashboards, reports, visualizations, and Business Intelligence solutions.
By learning Advanced Excel and Power BI together, learners can develop a practical workflow that starts with raw business data and ends with an interactive dashboard.
Raw Data → Excel → Data Cleaning → Data Analysis → Power Query → Data Modelling → DAX → Power BI Dashboard → Business Insights
The program is conducted through live mentor-led sessions, allowing students to interact with the trainer, ask questions, understand practical scenarios, complete exercises, and work on projects.
The focus is not simply on learning software features. The objective is to help learners understand how Excel and Power BI can be used together in real-world reporting and analytics environments.
Why Learn Advanced Excel & Power BI Together?
Excel and Power BI are complementary tools.
Excel is commonly used for:
Data preparation
Calculations
Business reports
Financial analysis
MIS reporting
Data entry
Data validation
Pivot Tables
Operational reporting
Power BI can then be used for:
Data transformation
Data modelling
Data visualization
Interactive reporting
KPI dashboards
Business Intelligence
Automated reporting workflows
Management dashboards
For example, a company may maintain sales information in Excel files. An analyst can clean the data, organize it, calculate important metrics, and then bring the information into Power BI to create an interactive dashboard.
This means the analyst is not only creating a chart but working through a complete data reporting workflow.
Live Advanced Excel & Power BI Training
The course is delivered through live instructor-led sessions.
During the sessions, learners can watch practical demonstrations, work on exercises, ask questions, discuss business scenarios, and receive guidance from the trainer.
The learning approach includes:
Live mentor-led sessions
Practical demonstrations
Hands-on exercises
Real-world datasets
Advanced Excel
Excel dashboards
Power Query
Power BI
DAX
Data modelling
Data visualization
Business reporting
Practical projects
Interview preparation
Career guidance
Placement assistance
The objective is to help students understand concepts by actually working with data.
Tools & Technologies Covered
The following tools and technologies are included in the Advanced Excel & Power BI Training program:
Tool / Technology
What You Learn
Microsoft Excel
Advanced formulas, data analysis and reporting
Excel Functions
IF, SUMIFS, COUNTIFS, XLOOKUP, INDEX-MATCH and more
Pivot Tables
Data summarization and analysis
Pivot Charts
Interactive Excel reporting
Excel Slicers
Interactive filtering
Excel Dashboards
KPI and business dashboards
Power Query in Excel
Data cleaning and transformation
Microsoft Power BI Desktop
Report and dashboard development
Power Query in Power BI
ETL and data preparation
DAX
Measures and analytical calculations
Data Modelling
Tables and relationships
Power BI Visualizations
Charts, cards, tables and KPIs
Power BI Slicers
Interactive dashboard filtering
Power BI Service
Basic publishing and sharing concepts
Excel + Power BI
End-to-end reporting workflow
Advanced Excel Training
The Excel component takes learners beyond basic spreadsheet operations.
You will learn how to use Excel for professional data analysis and reporting.
Advanced Excel Functions
Topics include:
IF
IFS
SUMIF
SUMIFS
COUNTIF
COUNTIFS
AVERAGEIF
AVERAGEIFS
XLOOKUP
VLOOKUP
HLOOKUP
INDEX
MATCH
IFERROR
Text functions
Date functions
Logical functions
Mathematical functions
Statistical functions
Rather than simply memorizing formulas, students learn where these functions can be applied to real business datasets.
Advanced Excel Data Analysis
You will work with datasets to answer practical business questions.
Examples include:
Which product generated the highest revenue?
Which region has the highest sales?
Which customer contributed the most revenue?
Which month had the highest sales?
What is the average order value?
Which employees achieved their targets?
Which products are underperforming?
What is the month-over-month growth?
This helps learners understand Excel as a data analysis tool rather than simply a spreadsheet application.
Pivot Tables & Pivot Charts
Pivot Tables are an important part of professional Excel reporting.
You will learn:
Creating Pivot Tables
Grouping data
Filtering data
Summarizing large datasets
Creating calculated values
Working with dates
Creating Pivot Charts
Using slicers
Building summary reports
You can use Pivot Tables to create:
Sales reports
Revenue reports
Employee reports
Expense reports
Customer reports
Product reports
Regional reports
Excel Dashboard Development
You will learn how to combine formulas, Pivot Tables, charts, slicers, and formatting to create professional dashboards.
An Excel dashboard can include:
Total Revenue
Total Sales
Total Orders
Total Customers
Monthly Sales
Regional Performance
Product Performance
Sales Target
Actual vs Target
Growth Percentage
The objective is to transform a large dataset into a simple visual report that business users can understand quickly.
Power Query for Data Cleaning
Power Query is an important part of the Excel and Power BI workflow.
You will learn how to:
Import data
Remove unnecessary columns
Filter rows
Change data types
Rename columns
Remove duplicates
Handle missing values
Split columns
Merge datasets
Append datasets
Transform data
Prepare datasets for analysis
This is particularly useful when working with raw data received from different sources.
Microsoft Power BI Training
The Power BI component introduces learners to modern Business Intelligence and interactive reporting.
You will learn:
Power BI Desktop
Power BI interface
Reports
Dashboards
Data sources
Visualizations
Filters
Slicers
Report pages
Interactive reporting
For learners who want to specialize further in Power BI, you can also explore our Microsoft Power BI Training.
Connecting Data to Power BI
You will learn how Power BI can connect with different data sources, including:
Excel
CSV
Text files
Structured datasets
Databases
SQL-based data sources
You will understand how data can move from a source file or database into Power BI for transformation, modelling, analysis, and visualization.
Data Modelling in Power BI
Data modelling is an important part of building reliable Power BI reports.
You will learn concepts such as:
Tables
Relationships
Primary fields
Related fields
Fact tables
Dimension tables
Relationship concepts
Data model organization
Understanding relationships between tables helps learners build more structured and reliable reports.
DAX for Data Analytics
DAX stands for Data Analysis Expressions and is used to create calculations in Power BI.
You will learn practical concepts such as:
Measures
Calculated columns
SUM
COUNT
DISTINCTCOUNT
DIVIDE
IF
CALCULATE
Percentage calculations
Growth calculations
KPI calculations
Examples include:
Total Sales
Total Orders
Total Customers
Average Order Value
Sales Growth
Profit Margin
DAX allows learners to create business calculations that respond dynamically to dashboard filters.
Power BI Dashboard Development
The course includes practical dashboard development using:
Bar charts
Column charts
Line charts
Pie charts
Donut charts
Tables
Matrices
Cards
KPI visuals
Slicers
Filters
Interactive visuals
You will learn how to combine these elements into professional business dashboards.
Practical Advanced Excel & Power BI Projects
Projects are an important component of the course.
1. Sales Performance Dashboard
Build a complete sales dashboard containing:
Total revenue
Total orders
Product performance
Regional sales
Monthly sales
Customer performance
Sales growth
Target vs actual
The project demonstrates the complete Excel-to-Power-BI reporting workflow.
2. E-Commerce Analytics Dashboard
Analyze:
Orders
Revenue
Products
Customers
Categories
Regions
Monthly trends
3. HR Analytics Dashboard
Create an HR report covering:
Employee count
Department-wise employees
Attrition
Hiring trends
Employee experience
Department performance
4. Financial Performance Dashboard
Analyze:
Revenue
Expenses
Profit
Budget
Actual performance
Monthly financial trends
5. Marketing Analytics Dashboard
Analyze:
Leads
Campaign performance
Conversions
Marketing channels
Customer acquisition
Campaign costs
6. Inventory Dashboard
Analyze:
Stock levels
Product movement
Inventory value
Low-stock products
Category performance
Warehouse data
7. Final Data Analytics Project
The final project can combine:
Excel → Power Query → Data Cleaning → Data Modelling → DAX → Power BI → Dashboard → Business Insights
This provides learners with a complete project they can explain during interviews.
Career Opportunities After Advanced Excel & Power BI
Advanced Excel and Power BI skills can be relevant to several reporting and analytics roles.
Possible career paths include:
Data Analyst
Junior Data Analyst
Power BI Developer
BI Analyst
Reporting Analyst
MIS Analyst
Business Analyst
Reporting Developer
Data Visualization Specialist
Business Intelligence Analyst
Operations Analyst
Financial Reporting Analyst
The exact requirements vary by company. Many employers may also expect SQL, statistics, Python, domain knowledge, or other technical skills depending on the role.
Advanced Excel & Power BI Salary in India
Salary varies considerably depending on experience, company, city, industry, role, technical skills, and interview performance.
Current 2026 salary data shows a broad range for Data Analyst and Power BI-related roles. Glassdoor's India data currently reports Data Analyst compensation with a median around ₹6.71 lakh per year, while Power BI/Data Analyst-specific results show substantial variation by employer and experience.
An indicative career range can therefore be presented as:
Experience
Indicative Salary Range
0–1 Year / Fresher
₹3.5 LPA – ₹6 LPA
1–3 Years
₹5 LPA – ₹9 LPA
3–5 Years
₹8 LPA – ₹14 LPA
5+ Years
₹12 LPA – ₹22 LPA+
These are indicative market ranges, not guaranteed salaries. Actual compensation can be higher or lower depending on employer, location, skills, role, domain, and experience. Current job and salary data also shows significant variation between employers and cities.
Major Companies Hiring for Analytics & BI Roles
Professionals with Excel, Power BI, SQL, and broader Data Analytics skills may find relevant opportunities across IT services, consulting, financial services, retail, e-commerce, healthcare, manufacturing, logistics, and technology companies.
Examples of companies with Data Analyst, BI, reporting, and analytics roles include:
Tata Consultancy Services (TCS)
Accenture
Infosys
Cognizant
Deloitte
Genpact
Wipro
HCLTech
Tech Mahindra
Capgemini
IBM
S&P Global
Amazon
Flipkart
Walmart
Reliance
EY
KPMG
PwC
For example, current job listings include Power BI/Data Analyst opportunities in Mumbai, while salary databases show companies such as TCS, Accenture, Cognizant, Deloitte, Infosys and S&P Global among employers associated with Data Analyst roles.
The companies listed above are examples of organizations operating in relevant technology, consulting, analytics, finance, retail, and business sectors; their presence does not represent a placement guarantee from JustAcademy.
Major Tier-1 Cities for Data Analytics Careers
Data Analytics and Business Intelligence opportunities are concentrated across several major Indian technology and business hubs.
Mumbai
Mumbai has opportunities across:
BFSI
Consulting
Financial services
Retail
Media
E-commerce
Corporate analytics
Business Intelligence
Current job listings show Power BI and Data Analyst opportunities in Mumbai across different organizations.
Bengaluru
Bengaluru is a major technology and startup ecosystem with opportunities across:
Technology
SaaS
Product companies
E-commerce
FinTech
Analytics
Global Capability Centres
Hyderabad
Hyderabad has opportunities across:
IT services
Technology
Healthcare
Financial services
Global Capability Centres
Business Intelligence
Pune
Pune has a strong presence across:
IT services
Automotive
Manufacturing
Banking
Technology
Consulting
Business Analytics
Delhi NCR
Delhi NCR, including Delhi, Noida and Gurugram, has opportunities across:
Consulting
IT services
Financial services
E-commerce
Startups
Corporate analytics
Business Intelligence
Chennai
Chennai has opportunities across:
IT services
Automotive
Manufacturing
Banking
Technology
Business Operations
Analytics
These cities provide different combinations of technology, financial services, consulting, manufacturing, e-commerce, and corporate analytics opportunities. The specific number of jobs and compensation changes continuously.
Advanced Excel & Power BI for Working Professionals
Working professionals often spend considerable time creating repetitive reports.
Advanced Excel and Power BI can help professionals improve the way they prepare and present business information.
For example:
A Finance Professional can build financial dashboards.
A Sales Professional can analyze revenue and targets.
An HR Professional can create employee analytics.
A Marketing Professional can analyze campaign performance.
An Operations Professional can monitor KPIs.
An MIS Executive can create recurring management reports.
The training helps learners understand how analytics tools can be applied to different business functions.
Advanced Excel & Power BI for Freshers
Fresh graduates can use this course to develop practical reporting and dashboard skills.
Instead of learning only theoretical Data Analytics concepts, students can build projects involving:
Excel data analysis
Pivot Tables
Excel dashboards
Power Query
Power BI
DAX
Data modelling
Interactive dashboards
These projects can provide examples to discuss during interviews.
Advanced Excel & Power BI for Career Change
Professionals from non-technical backgrounds can also consider this learning path if they want to move toward reporting and analytics.
People from backgrounds such as:
Commerce
Finance
Administration
Sales
Marketing
HR
Operations
Banking
Management
may find Excel and Power BI particularly relevant because both tools are widely used for business reporting.
The course can provide a structured path:
Excel → Advanced Excel → Data Analysis → Power BI → Dashboard Development → Business Intelligence
Build a Professional Data Analytics Portfolio
A certificate alone does not demonstrate everything you can do with Excel and Power BI.
Practical projects can help you demonstrate your skills.
A portfolio can contain:
Excel dashboards
Sales analysis
HR analytics
Financial reports
Marketing dashboards
Power BI dashboards
DAX calculations
Data modelling examples
Business insights
During an interview, you should be able to explain the complete workflow:
Where did the data come from?
How did you clean it?
Which Excel functions did you use?
How did you create the data model?
Why did you use specific visualizations?
Which DAX calculations did you create?
What business insights did you identify?
This practical understanding can help you communicate your capabilities more effectively.
Related Data Analytics Training
Advanced Excel and Power BI can be the starting point for a broader Data Analytics learning path.
If you want to add programming and automation skills, explore our Python Training.
If you want to learn another major Business Intelligence and visualization platform, explore our Tableau Training.
For learners who want a broader job-focused analytics program covering multiple technologies and real-world projects, explore our Data Analytics Bootcamp.
Placement Assistance and Career Support
JustAcademy provides placement assistance to eligible students who complete the required training and project work.
Career support may include:
Resume guidance
Interview preparation
Technical interview preparation
Project explanation guidance
Job-search guidance
Relevant opportunity referrals
Direct company approaches where applicable
Career discussions
Placement assistance means support with referrals and career opportunities. It is not a guarantee of placement, salary, or employment.
The objective is to help learners become better prepared for the recruitment process through practical skills, projects, resume preparation, and interview guidance.
Certification and Project Support
After completing the required course and project work, learners can receive course completion and certification support.
The course emphasizes project work so that learners can demonstrate practical knowledge rather than relying only on a certificate.
You should be able to explain:
Excel formulas
Pivot Tables
Data cleaning
Power Query
Data modelling
DAX
Dashboard development
Business KPIs
Data visualization
Business insights
Why Choose JustAcademy?
JustAcademy focuses on practical and mentor-led technology training.
The Advanced Excel & Power BI Training program combines two highly useful analytics tools into one structured learning path.
Learners get exposure to:
Live mentor-led sessions
Advanced Excel
Excel formulas
Pivot Tables
Excel dashboards
Power Query
Microsoft Power BI
Data modelling
DAX
Interactive dashboards
Real-world datasets
Practical projects
Certification support
Interview preparation
Career guidance
Placement assistance
The objective is to help learners understand not only how to use Excel and Power BI, but also how to use them to solve business reporting and analytics problems.
Start Your Advanced Excel & Power BI Journey
If you want to develop practical Advanced Excel and Power BI skills, this course provides a structured path from spreadsheet-based analysis to modern Business Intelligence dashboards.
You will learn through live mentor-led sessions, practical exercises, real-world datasets, Excel dashboards, Power Query, Power BI, DAX, data modelling, visualization, and business analytics projects.
Whether you are a fresher, working professional, Excel user, MIS executive, finance professional, business professional, or aspiring Data Analyst, this course can help you build a practical foundation in Data Analytics and Business Intelligence.
You can also expand your skill set later with SQL, Python, Tableau, or a broader Data Analytics program depending on your career goals.
Enroll in Advanced Excel & Power BI Training
Learn Advanced Excel. Master Power BI. Build Real Dashboards. Develop Practical Data Analytics Skills.
Join JustAcademy for Advanced Excel & Power BI Training with live mentor-led sessions, practical projects, certification support, interview preparation, and placement assistance.
Curriculum
Curriculum will get updated soon.
Ready to Transform Your Career?
Get expert guidance on course selection, pricing, and flexible payment options. Our education counselors are ready to help you succeed.
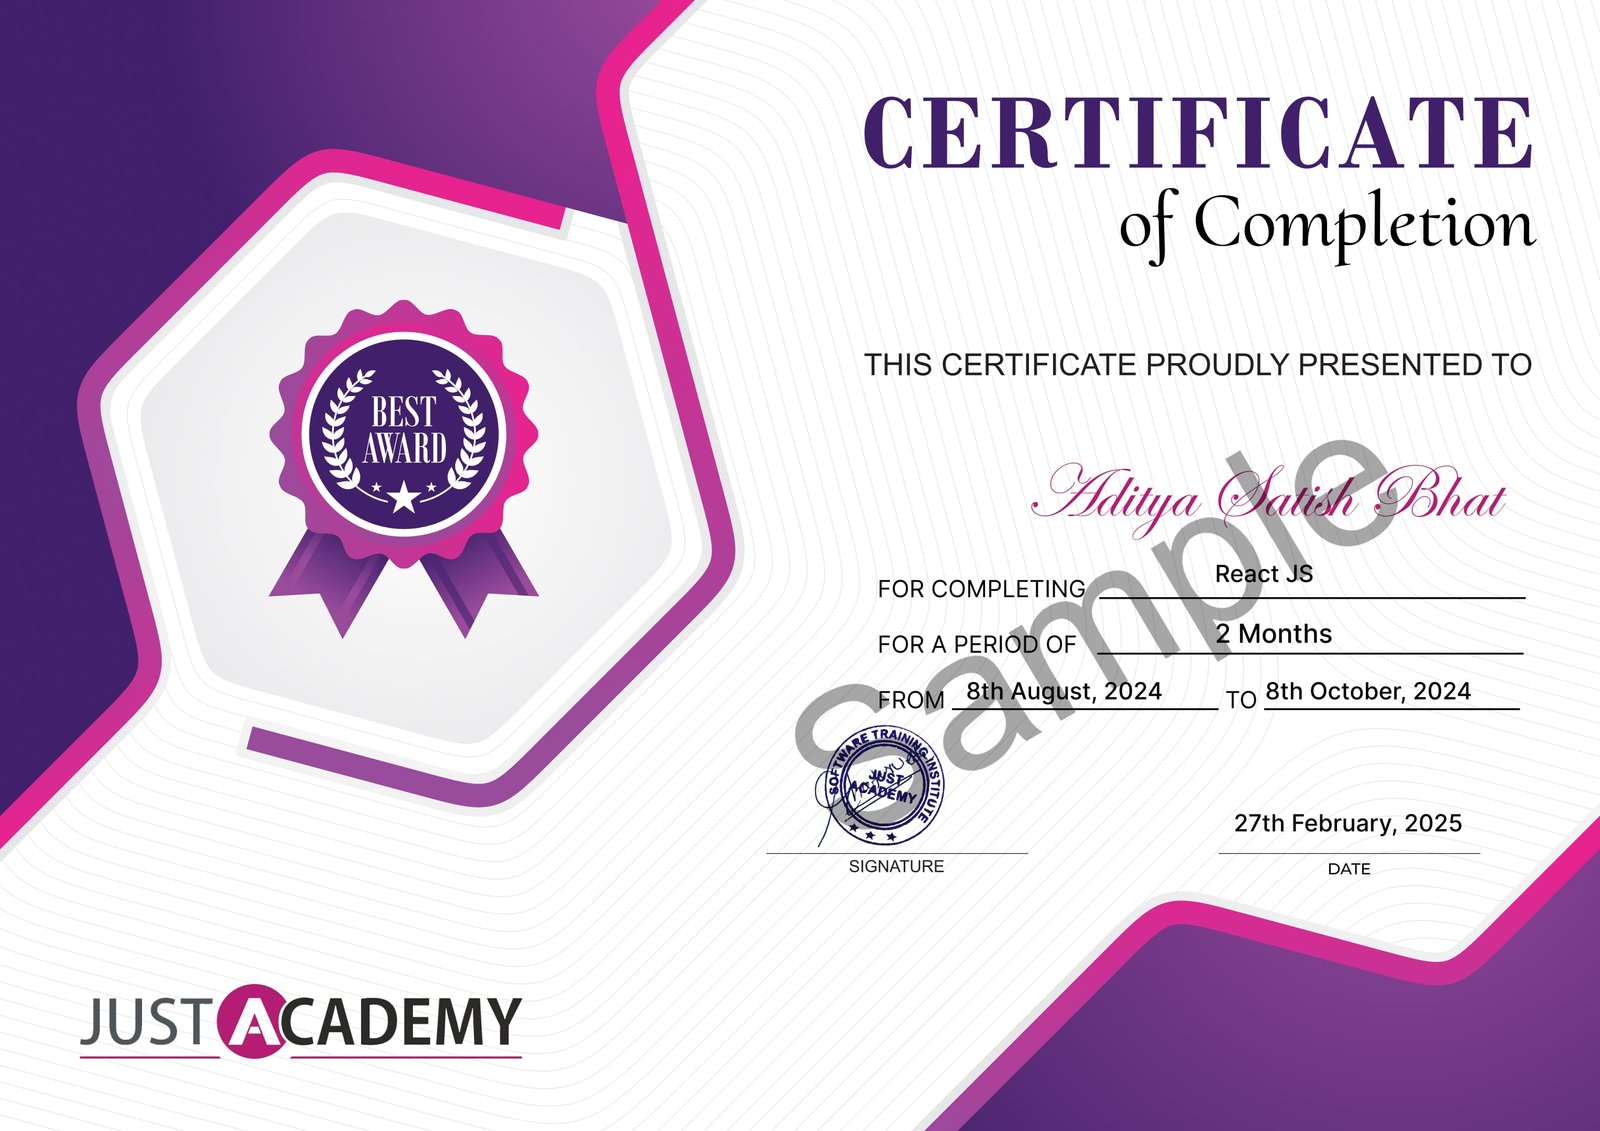
Upon successful completion of the Advanced Excel & Power BI course, you will receive a certificate from JustAcademy, validating your skills and expertise in this domain.
Industry-recognized certification
Validates your proficiency in Advanced Excel & Power BI
Enhances your resume and LinkedIn profile
Digital and printable formats available
Sample Certificate
What Makes JustAcademy Institute of Skills Training So Special?
This course is designed to provide practical, mentor-led training focused on real-world skills and project development. Students learn through live interactive sessions, hands-on exercises, industry-relevant tools, and practical projects rather than only theoretical concepts. The training is suitable for freshers, working professionals, and learners looking to upgrade their skills or transition into a new career. Along with technical training, students receive project guidance, certification support, and placement assistance to help them prepare for relevant job opportunities.