Tableau Course Live Sessions Projects amp Placement AssistanceEnroll in a practical Tableau Course designed for students freshers working professionals and aspiring data analysts who want to build skills in data visualization business intelligence and dashboard development The course focuses on live instructor-led sessions mentor guidance hands-on projects and real-world datasets
Tableau Course | Live Sessions, Projects & Placement Assistance
Enroll in a practical Tableau Course designed for students, freshers, working professionals and aspiring data analysts who want to build skills in data visualization, business intelligence and dashboard development. The course focuses on live instructor-led sessions, mentor guidance, hands-on projects and real-world datasets to help learners develop practical Tableau skills.
Through live sessions, learners work with Tableau and related data analytics tools to transform raw business data into interactive dashboards, reports and meaningful insights. The training includes practical assignments, project development, doubt-solving and mentor guidance throughout the learning process.
What is Tableau?
Tableau is a business intelligence and data visualization platform used to connect, analyze and present data through interactive dashboards and reports. It enables users to work with different data sources, create visualizations and communicate business insights effectively.
Tableau is widely used for sales analysis, financial reporting, marketing analytics, customer analysis, operations and business intelligence.
What You Will Learn in Tableau Course
Tableau fundamentals and data visualization concepts
Connecting Tableau with Excel, CSV, SQL and other data sources
Data preparation and basic data cleaning
Dimensions, measures, hierarchies and data types
Charts, graphs and interactive visualizations
Filters, parameters and calculated fields
Sets, groups and table calculations
Dashboard and worksheet creation
Interactive reports and KPI dashboards
Data storytelling and business insights
Dashboard design and visualization best practices
Publishing and sharing Tableau dashboards
Practical business analytics using real-world datasets
By the end of the course, learners will be able to create professional dashboards, analyze business data and present data-driven insights using Tableau.
Tableau Tools & Technologies
During the training, learners get practical exposure to tools and technologies commonly used in data analytics and business intelligence:
Tool / Technology
Application
Tableau
Data visualization and dashboard development
Tableau Desktop
Dashboard and report creation
Tableau Public
Dashboard publishing and portfolio building
Microsoft Excel
Data preparation and analysis
SQL
Database querying and data extraction
Power BI
Business intelligence and dashboard development
Python
Data analysis and automation
CSV / Excel Data
Working with structured datasets
Real-World Tableau Projects You Will Build
The course focuses on project-based learning so that learners can apply Tableau concepts to practical business scenarios.
1. Sales Performance Dashboard
Build an interactive dashboard to analyze sales, revenue, products, regions and sales performance.
2. Customer & Product Analysis Dashboard
Analyze customer segments, purchasing behavior, product performance and business trends.
3. Business KPI Dashboard
Create an interactive management dashboard with KPIs, filters, charts and performance indicators.
4. E-Commerce Analytics Dashboard
Analyze orders, revenue, products, customers and regional performance using an e-commerce dataset.
5. HR Analytics Dashboard
Build a dashboard to analyze employee data, departments, attrition, experience and workforce trends.
6. Financial Analytics Dashboard
Analyze revenue, expenses, profit and financial performance using interactive Tableau visualizations.
These projects help learners gain practical experience, develop portfolio projects and understand how Tableau is used for real-world business analysis.
Features of Tableau Training Program
Live instructor-led Tableau sessions
Practical, project-based learning
Mentor guidance and dedicated doubt-solving
Real-world business datasets
Hands-on dashboard development
Practical assignments and exercises
Resume-building guidance
Interview preparation
Tableau project portfolio development
Course completion certification
Placement assistance and career guidance
Live Tableau Sessions & Mentor Guidance
The Tableau course is delivered through live sessions, where the trainer explains concepts and demonstrates practical implementation. Learners get opportunities to practise during the sessions and work on projects under trainer supervision.
Mentor guidance helps learners understand dashboard development, troubleshoot issues, improve visualization techniques and complete their projects with practical implementation.
Who Should Enroll in This Tableau Course?
This Tableau course is suitable for:
Students interested in data analytics
Freshers starting a career in business intelligence
Beginners entering the data analytics field
Excel users who want to learn advanced visualization
Working professionals upgrading their analytics skills
Business analysts and reporting professionals
Data analysts looking to strengthen dashboard skills
Professionals switching to data analytics careers
No advanced programming knowledge is required to get started with Tableau.
Career Opportunities After Tableau Course
After completing the Tableau training and developing practical project experience, learners can explore roles such as:
Data Analyst
Tableau Developer
Business Intelligence Analyst
Data Visualization Specialist
Reporting Analyst
Business Analyst
BI Developer
Data Reporting Executive
Combining Tableau with SQL, Excel, Power BI and Python can help learners build a broader data analytics skill set.
Tableau Salary in India
Tableau professionals can work across industries such as IT, finance, healthcare, retail, e-commerce, consulting and business services.
Average Salary Range in India
Experience
Approximate Salary Range
Freshers / 0–1 Year
₹3 LPA – ₹6 LPA
1–3 Years
₹6 LPA – ₹12 LPA
3–5 Years
₹10 LPA – ₹16 LPA+
Experienced Professionals
₹12 LPA – ₹20 LPA+
Actual salary depends on experience, location, organization, job role and additional skills such as SQL, Excel, Power BI and Python.
Industries Using Tableau
Tableau and data visualization skills are applicable across multiple industries, including:
Information Technology
Banking and Finance
Healthcare
E-Commerce
Retail
Manufacturing
Consulting
Telecommunications
Education
Logistics and Supply Chain
Marketing and Advertising
Why Enroll in a Tableau Course?
Build practical data visualization skills
Attend live instructor-led sessions
Work on real-world datasets
Build portfolio-ready Tableau projects
Learn dashboard and KPI development
Receive mentor guidance during projects
Strengthen your data analytics profile
Prepare for interviews and analytics roles
Get certification after course completion
Receive placement assistance for relevant career opportunities
Related Data Analytics Courses
Build a broader data analytics skill set by combining Tableau with other important tools:
Power BI – Learn interactive dashboards and business intelligence.
Python – Develop data analysis and automation skills.
Don't limit your Tableau learning to theoretical concepts. During the training, work on practical dashboards and business datasets that demonstrate your ability to analyze data and communicate insights.
Your project portfolio can include sales dashboards, customer analytics, HR analytics, financial reports, e-commerce dashboards and KPI-based business reports.
These projects can be used to demonstrate your practical Tableau skills during interviews and career opportunities.
Enroll in Tableau Course Today
Ready to build practical skills in Tableau, data visualization and business intelligence?
Enroll in the Tableau Course at JustAcademy and get access to live sessions, mentor guidance, hands-on projects, real-world datasets, certification and placement assistance.
Build interactive dashboards. Create real-world projects. Strengthen your data analytics skills. Prepare for your next career opportunity.
Enroll today and start building your Tableau portfolio with practical, mentor-guided training.
Curriculum
Module 1: Introduction to Tableau, Data Visualizations & BI
What is data visualization & BI
Importance of visual analytics
Introduction to Tableau ecosystem
Tableau Desktop, Server & Public
Installing Tableau & setup
Tableau interface overview
Module 2: Data, Analytics, ETL & Business Intelligence Fundamentals
Types of data (structured, unstructured)
Data analysis lifecycle
Basics of Excel for analytics
ETL (Extract, Transform, Load) concept
Business intelligence fundamentals
Module 3: Tableau Data Connection, Extracts, Metadata & Multiple Data Sources
Connecting to Excel, CSV, SQL databases
Live connection vs Extract mode
Data types & metadata
Data refresh strategies
Working with multiple data sources
Module 4: Data Cleaning, Sorting, Filtering, Grouping, Pivoting, Joins, Union & Data Shaping
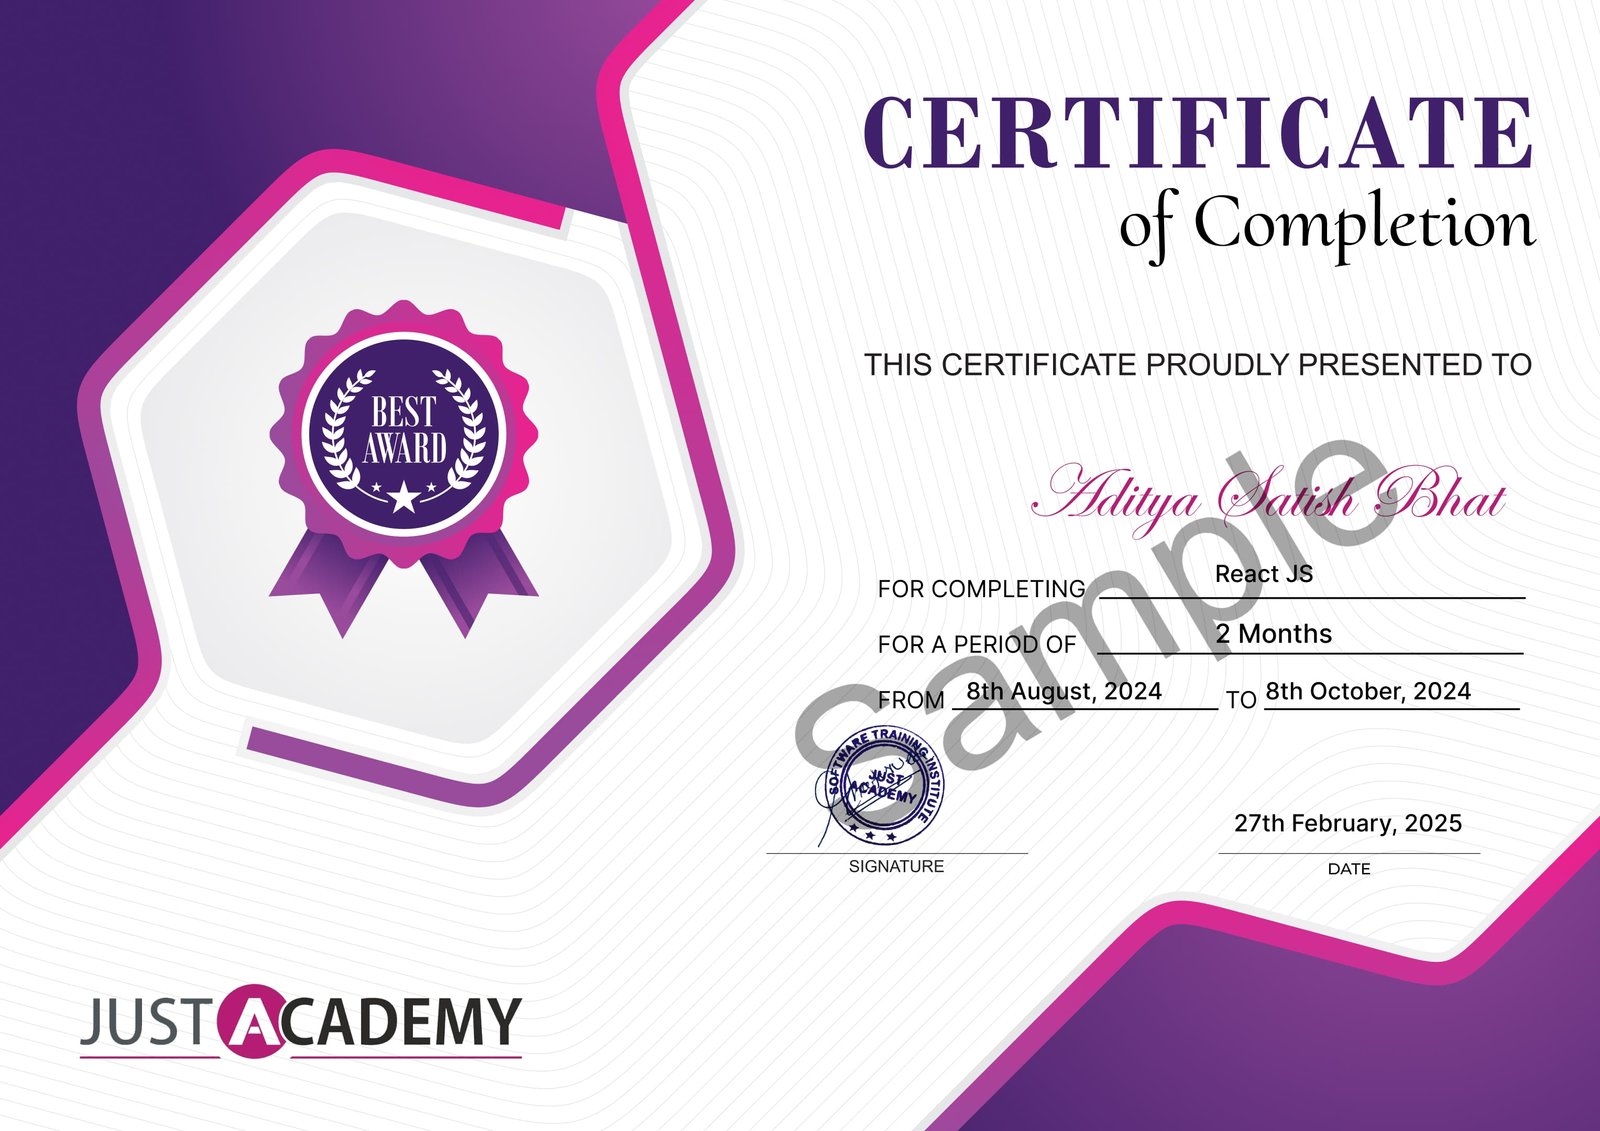
Upon successful completion of the Tableau Training course, you will receive a certificate from JustAcademy, validating your skills and expertise in this domain.
Industry-recognized certification
Validates your proficiency in Tableau Training
Enhances your resume and LinkedIn profile
Digital and printable formats available
Sample Certificate
What Makes JustAcademy Institute of Skills Training So Special?
JustAcademy’s Tableau Course is designed for learners who want to build practical skills in data visualization, business intelligence and dashboard development. The course provides live instructor-led sessions with mentor guidance, allowing learners to understand Tableau concepts and practise them during the training. Learners work with Tableau, Excel, SQL and real-world business datasets to create interactive dashboards and meaningful insights. Practical projects such as sales, customer, HR, e-commerce and KPI dashboards help learners build a strong project portfolio. The training also focuses on data preparation, calculated fields, filters, parameters, dashboard design and data storytelling. Learners receive certification, project guidance and placement assistance to help prepare for relevant data analytics opportunities.
Student Reviews
Vikas Das
5
I have completed the course successfully, and it was a great learning experience. The trainer explained all the topics very clearly and was always ready to solve our doubts. The hands-on training in Borivali helped me understand the concepts in a much more practical way. Thank you for the continuous support and guidance throughout the course.
Course FAQ's
It is a practical tableau developer course covering data visualization, calculated fields, dashboards, stories, live connections, Tableau Desktop, Tableau Server and live projects with certification and placement support for students and working professionals.
This tableau course for beginners is open to anyone with basic computer and data knowledge. It is suitable for freshers, students, working professionals and career switchers looking for a tableau course with placement assistance.
The tableau training program is available in flexible weekday, weekend and fast track batch options for students joining tableau online classes across India making it easy to learn at your own pace.
Yes. After completing the tableau certification course online and clearing the assessment exam you will receive an industry recognized certificate valued by top IT companies, MNCs and data driven organizations across India.
The tableau developer salary in india starts from INR 3.5 LPA to INR 5.5 LPA for freshers and grows up to INR 12 LPA to INR 20 LPA for senior developers depending on skills, experience and location.
Yes. This tableau course with placement assistance includes resume building, mock interviews, portfolio preparation and referrals to 650 plus hiring companies after course completion.
Yes. Tableau training online with live projects is available through instructor led sessions with practical dashboard building, doubt solving and real time project development accessible from anywhere in India.
The tableau course with live projects covers Tableau Desktop, connecting data sources, calculated fields, table calculations, data blending, interactive dashboards, stories, Tableau Server, Tableau Public and complete live project development.
Yes. Learning tableau step by step online opens strong data analyst jobs after tableau course across IT companies, BFSI, retail, healthcare and e-commerce. The scope of tableau in india is growing rapidly making it one of the most in demand data visualization tools.
After completing the tableau certification course with certificate you can apply for roles like Tableau Developer, Data Analyst, Business Intelligence Analyst, Reporting Analyst, Data Visualization Specialist and MIS Analyst with strong salary packages.