Power BI Course Live Sessions Projects amp Placement AssistanceEnroll in a practical Power BI Course designed for students freshers Excel users working professionals and aspiring data analysts who want to build skills in data analytics business intelligence and dashboard development The course focuses on live instructor-led sessions mentor guidance hands-on
Power BI Course | Live Sessions, Projects & Placement Assistance
Enroll in a practical Power BI Course designed for students, freshers, Excel users, working professionals and aspiring data analysts who want to build skills in data analytics, business intelligence and dashboard development. The course focuses on live instructor-led sessions, mentor guidance, hands-on projects and real-world datasets to help learners develop practical Power BI skills.
Through live sessions, learners work with Power BI and related data analytics tools to transform raw business data into interactive dashboards, reports and meaningful insights. The training includes practical assignments, project development, doubt-solving and mentor guidance throughout the learning process.
What is Power BI?
Microsoft Power BI is a business intelligence and data visualization platform used to connect, transform, analyze and visualize data. It helps organizations create interactive dashboards, reports and business insights from different data sources.
Power BI is widely used for sales analytics, financial reporting, customer analysis, HR analytics, operations, marketing and business intelligence.
What You Will Learn in Power BI Course
Power BI fundamentals and data analytics concepts
Connecting Power BI with Excel, CSV, SQL and other data sources
Power Query for data cleaning and transformation
Data preparation and data profiling
Data modeling and relationship building
Star schema and dimensional modeling concepts
Creating charts, graphs and interactive visualizations
Filters, slicers and drill-through
DAX fundamentals and advanced calculations
Measures, calculated columns and calculated tables
Time intelligence and analytical calculations
KPI and performance dashboard creation
Report design and interactive dashboard development
Data storytelling and business insights
Publishing and sharing Power BI reports
Power BI best practices for business reporting
By the end of the course, learners will be able to create professional Power BI dashboards, analyze business data and present data-driven insights effectively.
Power BI Tools & Technologies
During the training, learners get practical exposure to tools and technologies commonly used in data analytics:
Tool / Technology
Application
Microsoft Power BI
Dashboard and business intelligence development
Power BI Desktop
Report and dashboard creation
Power Query
Data cleaning and transformation
DAX
Data analysis and calculations
Microsoft Excel
Data preparation and analysis
SQL
Database querying and data extraction
Power BI Service
Publishing and sharing reports
CSV / Excel Data
Working with structured datasets
Python
Data analysis and advanced analytics
Real-World Power BI Projects You Will Build
The course focuses on practical project development so learners can apply Power BI concepts to real business scenarios.
1. Sales Performance Dashboard
Build an interactive dashboard to analyze sales, revenue, products, regions and sales performance using KPIs and filters.
2. Customer & Product Analysis Dashboard
Analyze customer segments, purchasing behavior, product performance and business trends.
3. Business KPI Dashboard
Create an interactive management dashboard with KPIs, charts, filters and performance indicators.
4. E-Commerce Analytics Dashboard
Analyze orders, revenue, products, customers and regional performance using an e-commerce dataset.
5. HR Analytics Dashboard
Build a dashboard to analyze employees, departments, attrition, experience and workforce trends.
6. Financial Analytics Dashboard
Analyze revenue, expenses, profit and financial performance using interactive Power BI reports.
These projects help learners gain practical experience, develop portfolio projects and understand how Power BI is used for real-world business analysis.
Features of Power BI Training Program
Live instructor-led Power BI sessions
Practical and project-based learning
Mentor guidance and doubt-solving support
Real-world business datasets
Hands-on Power Query and DAX practice
Data modeling and dashboard development
Practical assignments and exercises
Resume-building guidance
Interview preparation
Power BI project portfolio development
Course completion certification
Placement assistance and career guidance
Live Power BI Sessions & Mentor Guidance
The Power BI course is delivered through live sessions, where the trainer explains concepts and demonstrates practical implementation. Learners can practise during the sessions and work on dashboards and projects under trainer supervision.
Mentor guidance helps learners understand Power Query, data modeling, DAX, dashboard design and troubleshooting while developing practical projects.
Who Should Enroll in This Power BI Course?
This Power BI course is suitable for:
Students interested in data analytics
Freshers starting a career in business intelligence
Beginners entering the data analytics field
Excel users who want to upgrade their analytics skills
Working professionals upgrading their reporting skills
Business analysts and reporting professionals
Data analysts looking to strengthen Power BI skills
Professionals switching to data analytics careers
No advanced programming knowledge is required to get started with Power BI.
Career Opportunities After Power BI Course
After completing the Power BI training and developing practical project experience, learners can explore roles such as:
Data Analyst
Power BI Developer
Business Intelligence Analyst
Reporting Analyst
Data Visualization Specialist
Business Analyst
BI Developer
Data Reporting Executive
Combining Power BI with SQL, Excel, Python and advanced analytics can help learners build a broader data analytics skill set.
Power BI Salary in India
Power BI professionals can work across industries such as IT, finance, healthcare, retail, e-commerce, consulting and business services.
Average Salary Range in India
Experience
Approximate Salary Range
Freshers / 0–1 Year
₹3 LPA – ₹6 LPA
1–3 Years
₹6 LPA – ₹12 LPA
3–5 Years
₹10 LPA – ₹16 LPA+
Experienced Professionals
₹12 LPA – ₹20 LPA+
Actual salary depends on experience, location, organization, job role and additional skills such as SQL, Excel, Python and advanced analytics.
Industries Using Power BI
Power BI skills are applicable across multiple industries, including:
Information Technology
Banking and Finance
Healthcare
E-Commerce
Retail
Manufacturing
Consulting
Telecommunications
Education
Logistics and Supply Chain
Marketing and Advertising
Why Enroll in Power BI Course?
Build practical data analytics skills
Attend live instructor-led sessions
Work with real-world datasets
Learn Power Query and DAX
Build portfolio-ready Power BI projects
Learn data modeling and dashboard development
Receive mentor guidance during projects
Strengthen your data analytics profile
Prepare for interviews and analytics roles
Receive certification after course completion
Get placement assistance and career guidance
Related Data Analytics Courses
Build a broader data analytics skill set by combining Power BI with other important tools:
Tableau – Develop data visualization and interactive dashboard skills.
Python – Build data analysis and automation skills.
Don't limit your Power BI learning to theoretical concepts. During the training, work on practical dashboards and business datasets that demonstrate your ability to clean, analyze and visualize data.
Your project portfolio can include sales dashboards, customer analytics, HR analytics, financial reports, e-commerce dashboards and KPI-based business reports.
These projects can help demonstrate your practical Power BI skills during interviews and relevant career opportunities.
Enroll in Power BI Course Today
Ready to build practical skills in Power BI, data analytics and business intelligence?
Enroll in the Power BI Course at JustAcademy and get access to live sessions, mentor guidance, hands-on projects, real-world datasets, certification and placement assistance.
Build interactive dashboards. Master Power Query and DAX. Create real-world projects. Strengthen your data analytics skills. Prepare for your next career opportunity.
Enroll today and start building your Power BI portfolio with practical, mentor-guided training.
Curriculum
Module 1: Introduction to Business Intelligence & Power BI
What is Business Intelligence (BI)
Role of data in decision-making
Introduction to Power BI ecosystem
Power BI Desktop, Service & Mobile
Installing Power BI Desktop
Overview of Power BI interface
Module 2: Data Fundamentals, Cleaning ETL & Data - Driven Decision Making
Types of data (structured, unstructured)
Data analysis lifecycle
Basics of Excel for analytics
Data cleaning concepts
Introduction to ETL (Extract, Transform, Load)
Data-driven decision making
Module 3: Data Sources, Connectivity, Import, DirectQuery & Refresh in Power BI
Connecting to multiple data sources (Excel, SQL, APIs)
Import vs Direct Query
Data refresh strategies
Working with cloud & local data
Data connectors in Power BI
Module 4: Power Query Editor, Data Cleaning, M Language & Data Shaping
Power Query Editor
Cleaning & transforming data
Filtering, sorting, merging queries
Removing duplicates & null values
M language basics
Data shaping techniques
Module 5: Power BI Data Modeling, Relationships, Schemas & Calculated Columns
Relationships (one-to-one, one-to-many)
Star schema vs snowflake schema
Data modeling best practices
Creating calculated columns
Data normalization basics
Module 6: DAX in Power BI - Basics, Aggregations, Logical Functions, Time Intelligence, Advanced, Advanced Calculations & Performance
DAX basics (measures vs columns)
Aggregation functions (SUM, COUNT, AVG)
Logical functions
Time intelligence (YTD, MTD)
Advanced DAX calculations
Performance optimization
Module 7: Power BI Visualizations, Formatting, Filters & Interactive Dashboards
Charts (bar, line, pie, maps)
Tables & matrix visuals
Custom visuals
Formatting & styling reports
Filters, slicers, drill-down
Interactive dashboards
Module 8: Dashboard Design, KPIs, Data Storytelling, Layout, Navigation & Best Practices
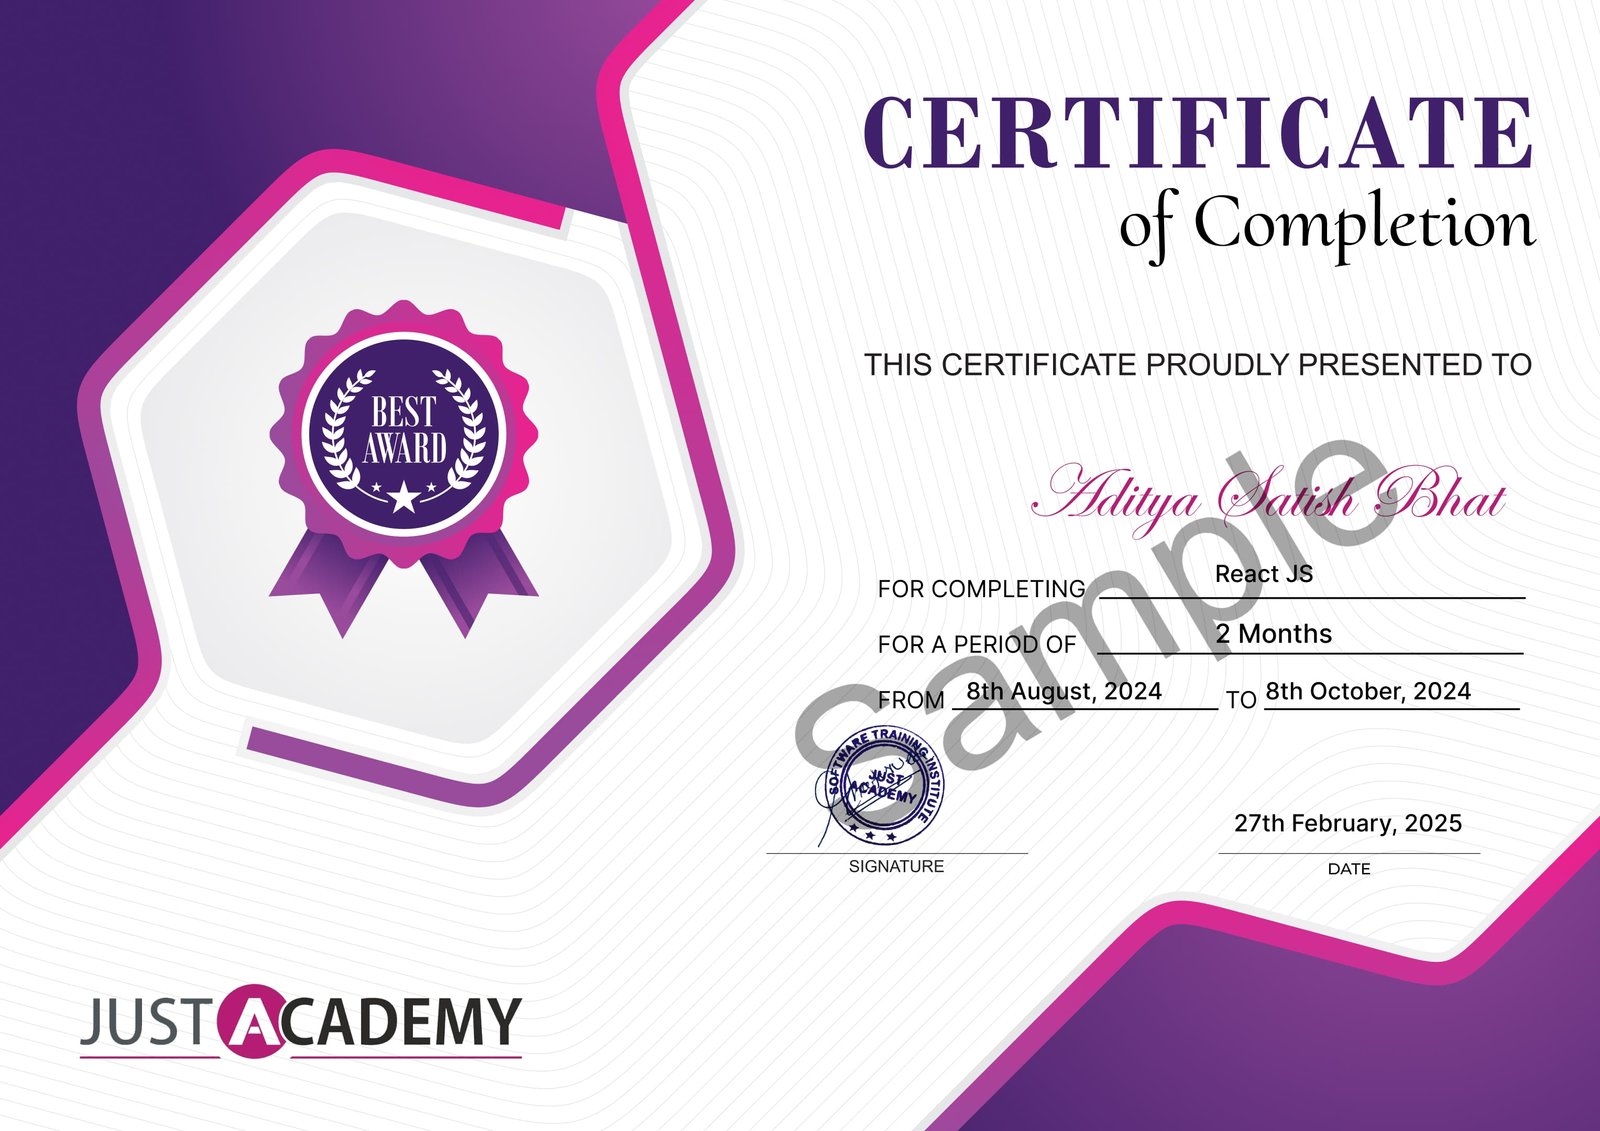
Upon successful completion of the Microsoft Power BI Training course, you will receive a certificate from JustAcademy, validating your skills and expertise in this domain.
Industry-recognized certification
Validates your proficiency in Microsoft Power BI Training
Enhances your resume and LinkedIn profile
Digital and printable formats available
Sample Certificate
What Makes JustAcademy Institute of Skills Training So Special?
JustAcademy’s Power BI Course is designed for learners who want to build practical skills in data analytics, business intelligence, data visualization and dashboard development. The course provides live instructor-led sessions with mentor guidance, allowing learners to understand Power BI concepts and practise them during the training. Learners work with Power BI, Power Query, DAX, Excel, SQL and real-world datasets to transform data into meaningful business insights. Practical Power BI projects such as sales, customer, HR, financial and KPI dashboards help learners build a strong portfolio. The training also covers data cleaning, data modeling, interactive reports, dashboard design and business reporting. Learners receive certification, project guidance and placement assistance to help prepare for relevant data analytics and Power BI career opportunities.
Student Reviews
Sandesh Shetty
5
I’m Sandhesh Sheety, currently working at Capgemini, and I recently completed my Power BI (Data Visualization) training at JustAcademy. Coming from an Operations background, I wanted to upskill into data visualization, and this course helped me make that transition smoothly. The trainer explained concepts like dashboards, reports, DAX, and data modeling in a very practical and easy-to-understand way. What I liked the most was the hands-on approach and real-time examples, which helped me build confidence in Power BI. The support from the team was also excellent throughout the training. I highly recommend JustAcademy to anyone looking to switch or grow their career in Data Analytics.
Jaesika Menon
4.7
I attended classroom Power BI with SQL training at JustAcademy in Mumbai and had a really good learning experience throughout the course. The practical approach and hands-on exercises helped me understand dashboards, reports, and SQL concepts much more clearly. Grateful to the trainers and team for their constant support and guidance during the training.
Nilesh Chaturvedi
5
My experience with JustAcademy for the Power BI course was excellent. The course content was very practical and industry-oriented, which helped me gain a strong understanding of DAX, dashboards, and chart creation. The training sessions were easy to follow, and every concept was explained clearly with real-world examples.
A special thanks to Mr. Roshan for being extremely supportive and proactive throughout the course. His regular follow-ups, guidance, and attention to every student’s progress were truly motivating. He always made sure that lectures were going smoothly and that assignments were being completed on time.
Overall, it was a great learning experience that not only improved my technical skills but also boosted my confidence in using Power BI. Highly recommended for anyone looking to build strong practical knowledge in Power BI.
Course FAQ's
It is a practical power bi developer course covering data visualization, DAX, Power Query, dashboards, reports and live projects with certification and placement support for students and working professionals.
This power bi course for beginners is open to anyone with basic computer and Excel knowledge. It is suitable for freshers, students, working professionals and career switchers looking for a power bi course with placement assistance.
The power bi training program is available in flexible weekday, weekend and fast track batch options for students joining power bi online classes across India making it easy to learn at your own pace.
Yes. After completing the power bi certification course online and clearing the assessment exam you will receive an industry recognized certificate valued by top IT companies, MNCs and data driven organizations across India.
The power bi developer salary in india starts from INR 3.5 LPA to INR 5.5 LPA for freshers and grows up to INR 12 LPA to INR 22 LPA for senior developers depending on skills, experience and location.
Yes. This power bi course with placement assistance includes resume building, mock interviews, portfolio preparation and referrals to 650 plus hiring companies after course completion.
Yes. Power bi training online with live projects is available through instructor led sessions with practical dashboard building, doubt solving and real time project development accessible from anywhere in India.
The power bi course with live projects covers Power BI Desktop, Power Query, DAX formulas, data modeling, interactive dashboards, reports, Power BI Service, SQL integration and complete live project development.
Yes. Learning power bi step by step online opens strong data analyst jobs after power bi course across IT companies, BFSI, retail, healthcare and e-commerce making it one of the most in demand data analytics tools in India.
After completing the power bi certification course with certificate you can apply for roles like Power BI Developer, Data Analyst, Business Intelligence Analyst, Reporting Analyst, MIS Analyst and Data Visualization Specialist with strong salary packages.