I am learning flutter from JustAcademy, They provide very much great environment where people gather and work simultaneously. totally project based training institute.
MOHD ABU BAKAR ANSARI
Flutter Developer
Awesome Experience. I am a Front-end Web Designer working at Star India for 3 years now. I applied for Full-stack development and my experience has been phenomenal & they really do help with placements exceptionally. Thank you Roshan sir so much.
A practical, no-fluff comparison to help students and working professionals pick the right business intelligence tool for their career in 2026.
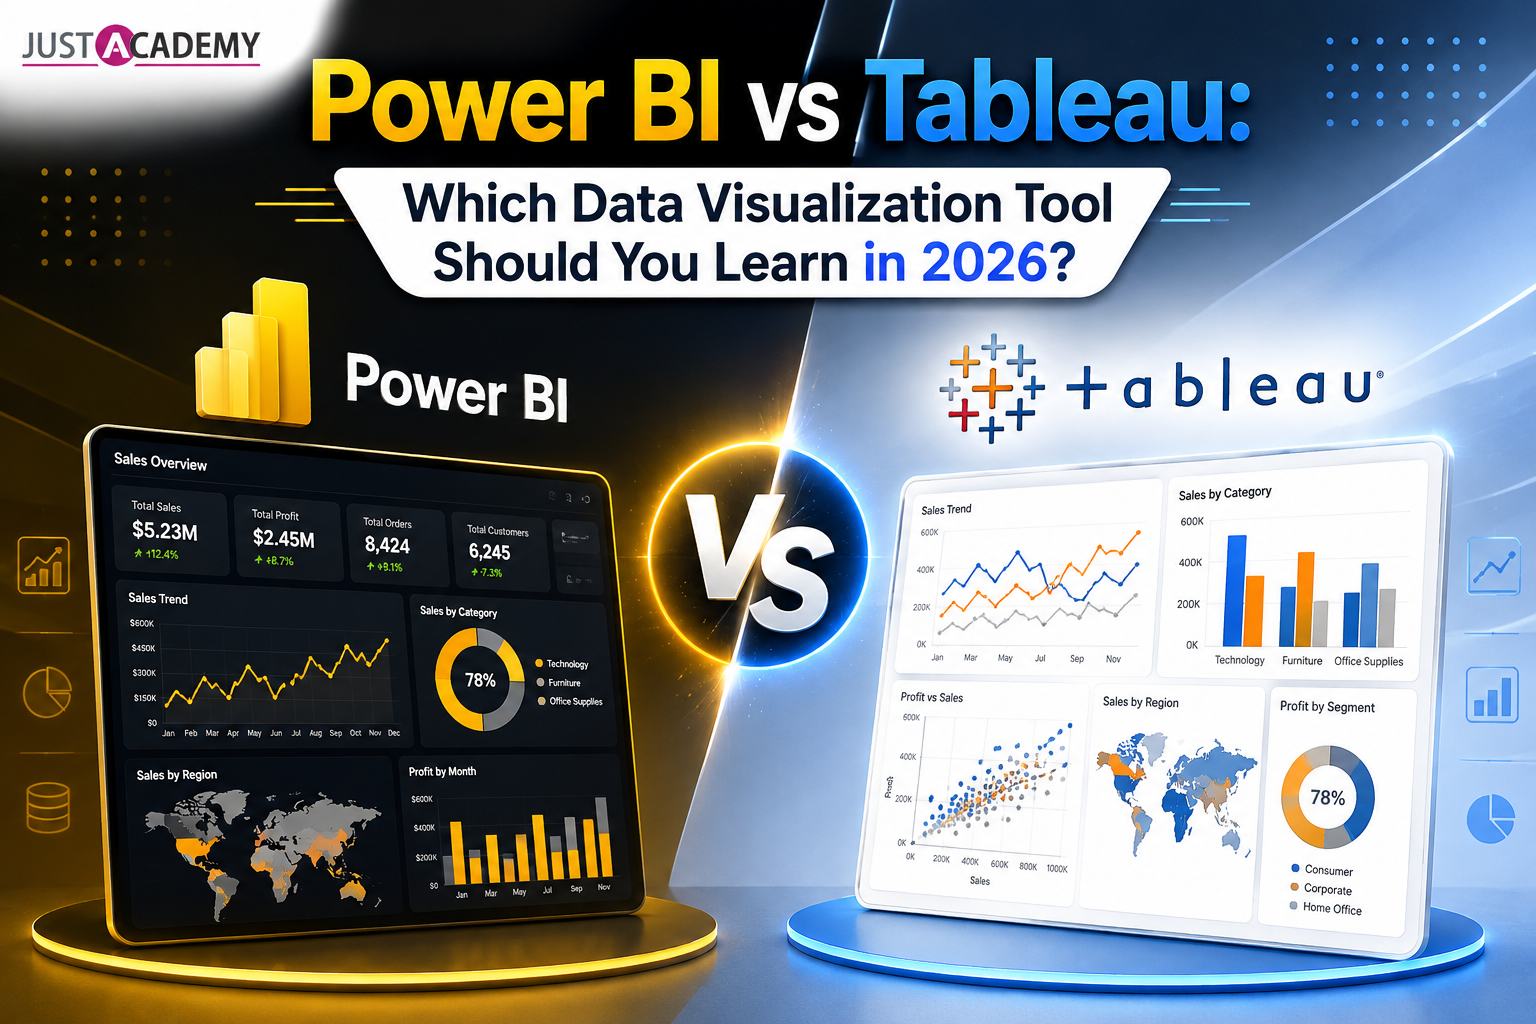
If you have spent even ten minutes scrolling through LinkedIn job postings for data roles, you already know the question that keeps popping up in every second comment section and every third YouTube video. Power bi vs tableau. It sounds like a small technical decision, almost like choosing between two similar phones, but for anyone trying to build a career in data analytics, it is actually a decision that shapes the next few years of your professional life. Recruiters ask for one or the other, sometimes both, and beginners are left staring at two logos wondering which one deserves their time.
This is exactly the confusion we see walking into our classrooms and online sessions every month. Some students arrive convinced that tableau for bi work is the only serious option because it looks more polished, while others have heard that power bi software is easier to pick up and lands more jobs simply because of Microsoft's reach. If you are weighing the same options right now, you can explore our Power BI training in Mumbai and our Tableau training in Mumbai to get a feel for how each course is structured, and if you would rather talk it through with someone first, you can also book a free demo session before committing to either one. This blog is our honest attempt to lay out the difference between tableau and power bi in plain language, without the marketing jargon, so that by the end you know exactly which tool deserves your first hundred hours of practice.
What Power BI Actually Is and Why Businesses Are Betting on It
Power BI is Microsoft's answer to the growing demand for accessible business intelligence. It connects to almost anything, Excel sheets, SQL databases, cloud warehouses, and even random CSV exports from a finance team that still lives in the nineties, and turns that mess into interactive reports. What is power bi and tableau at their core comes down to the same basic promise: take raw numbers and make them mean something to a human being looking at a screen. Power BI does this through a familiar Excel-like interface, DAX formulas for calculations, and a report builder that many beginners find less intimidating than a completely new visual grammar.
What really pushed power bi software into offices across India and beyond is its bundling with the Microsoft ecosystem. If a company already uses Excel, Teams, and Azure, adding Power BI is barely a decision at all, it is a default. There is also the power bi report server option for organizations that want to keep everything on their own infrastructure instead of the cloud, which matters a lot to banks, government bodies, and healthcare companies that cannot casually move sensitive data outside their firewalls. For someone learning data visualization tools for the first time, this practical, plug and play nature of Power BI is a genuine advantage.
What Tableau Brings to the Table for Visualization Lovers
Tableau, on the other hand, was built by people who were obsessed with visualization long before it became a buzzword in every job description. Tableau features like its drag and drop canvas, its handling of geographic data, and its ability to create visuals that genuinely look like they belong in a magazine rather than a spreadsheet, have made it the tool of choice for analysts who care deeply about storytelling with data. Ask anyone who has worked with a large tableau database and they will tell you the same thing, it handles massive datasets with a smoothness that still impresses people even after years of use.
Tableau data analysis also shines in exploratory work. When you do not know exactly what question you are trying to answer yet, and you just want to poke around a dataset to see what patterns emerge, Tableau's interface encourages that kind of curiosity in a way few other tools manage. If you have ever browsed tableau dashboards examples online, you will notice a certain visual confidence in them, layered filters, smooth transitions, and a level of interactivity that makes viewers want to click around instead of just glancing and moving on. This is part of why so many companies, especially in consulting, retail analytics, and marketing, still consider tableau bi tool the gold standard for client-facing dashboards.
Power BI vs Tableau Pros and Cons Nobody Tells You About
Most comparison articles online give you a diplomatic, both are great answer and leave it there, which is not particularly useful when you are the one trying to decide where to spend your evenings after work or college. So let us talk about the tableau vs power bi pros and cons that rarely make it into the polished marketing pages.
Power BI's biggest strength is speed of adoption. If you already know Excel, you will feel at home within your first week, and because it ships inside the Microsoft 365 suite that most companies already pay for, your learning translates almost immediately into workplace relevance. The downside is that Power BI can feel restrictive when you want highly customized, artistic visuals. DAX, its formula language, is genuinely powerful but has a learning curve of its own that catches many beginners off guard, especially when dealing with time intelligence functions or complex relationships between tables.
Tableau's biggest strength is exactly the opposite. Its visual flexibility is almost unmatched, and once you understand its logic of dimensions, measures, and calculated fields, you can build almost anything you can imagine on a canvas. The tradeoff is a steeper initial learning curve. New users often feel a little lost during their first few sessions because Tableau does not hold your hand the way Power BI's guided report builder does. Licensing cost is the other honest downside, since Tableau Creator licenses add up quickly for individuals or small teams compared to Power BI Pro.
Neither list of pros and cons should scare you away from either tool. Every professional skill worth having comes with some friction in the beginning, and both platforms reward the people who push past that first uncomfortable week of confusion.
Power BI vs Tableau: A Feature by Feature Comparison Matrix
Numbers and features rarely settle an argument on their own, but they do give you something solid to stand on before you make a choice. Here is a straightforward tableau vs power bi comparison matrix covering the areas most beginners actually care about.
Feature
Power BI
Tableau
Ease of learning
Beginner friendly, especially for Excel users
Slightly steeper learning curve initially
Data handling capacity
Strong, improves with premium plans
Excellent, built for very large datasets
Visualization flexibility
Good, improving every year
Outstanding, industry benchmark
Integration
Deep integration with Microsoft products
Broad integration across many platforms
Pricing
Generally more affordable
Generally more expensive
Deployment
Cloud and on-premise via report server
Cloud, server, and desktop options
Community support
Large and rapidly growing
Mature and highly active
Best suited for
Business users, finance teams, Excel-heavy roles
Data analysts, consultants, visualization specialists
Neither tool wins outright on this table, and that is really the honest answer to tableau vs power bi which is better. It depends entirely on the kind of role you are aiming for and the industry you want to work in.
Pricing Talk: Power BI vs Tableau Cost Comparison for 2026
Budget is often the quiet factor that decides real world adoption, whether we are talking about a student choosing a course or a company choosing software for its entire analytics team. The power bi vs tableau pricing conversation usually tilts in Power BI's favor for smaller businesses. Power BI Pro is priced modestly per user per month, and Power BI Premium, aimed at larger organizations needing more capacity, still tends to land lower than comparable Tableau tiers when you calculate it across a full team.
Tableau's pricing has traditionally sat higher, particularly for its Creator and Explorer licenses, which is part of why many small and mid-sized businesses in India lean toward Power BI first and only bring in Tableau once their analytics needs and budgets grow. That said, the power bi vs tableau cost comparison should never be the only deciding factor for someone learning the tool rather than buying the software. As a fresher, your goal is skill and portfolio, not procurement decisions, so do not let pricing alone dictate which platform you invest your learning hours in.
Where Does Looker, SAS, and Cognos Fit Into This Conversation
No comparison of data visualization platforms would be complete without acknowledging the other players quietly sitting in the room. The looker vs powerbi debate comes up often among companies already inside the Google Cloud ecosystem, since Looker integrates tightly with BigQuery and offers a more code-driven, developer-friendly approach to reporting. It is powerful, but it demands more technical comfort than either Power BI or Tableau typically require from a beginner.
Then there is the older guard, sas vs tableau vs power bi is a comparison you will still hear in traditional industries like insurance, pharmaceuticals, and banking, where SAS has decades of statistical modeling history behind it. Similarly, cognos vs power bi vs tableau surfaces in enterprises that adopted IBM's ecosystem years ago and have not fully migrated away. These older business intelligence tools are not going extinct overnight, but for someone starting fresh in 2026, they are far less relevant to your first job search than Power BI or Tableau, which dominate current hiring demand across almost every sector.
Salary Expectations: Tableau vs Power BI Professionals in India
Money talks, and rightly so, when you are deciding where to spend your learning hours. The tableau vs power bi salary in india conversation does not have a dramatic winner, but there are patterns worth noting. Power BI professionals, especially those who also know SQL and Excel deeply, tend to find abundant entry-level and mid-level openings because so many companies across finance, retail, and IT services rely on Microsoft's stack. Tableau professionals, meanwhile, often command slightly higher packages in specialized roles, particularly in consulting firms, product companies, and analytics-heavy startups where visualization quality directly impacts client decisions.
For fresher data analyst jobs, the honest truth is that recruiters rarely reject a candidate for knowing only one tool, but they are far more impressed by candidates who understand the underlying logic of data analysis using sql alongside either platform. SQL is the quiet skill that multiplies the value of whichever visualization tool you choose, and we always encourage our students to treat it as a non-negotiable part of their learning path rather than an afterthought.
City and experience level shift these numbers quite a bit too. Analysts working in Mumbai, Pune, Bangalore, and Hyderabad generally see higher starting packages than smaller cities simply because more product companies and consulting firms are headquartered there. A fresher with a couple of solid dashboard projects and working SQL knowledge can realistically expect a respectable entry-level package within the first year, and that number climbs steadily once you cross the two to three year mark and start owning end-to-end reporting projects rather than just building charts on request. Certifications help open the first interview door, but what actually gets you the offer letter is being able to explain the business reasoning behind a dashboard, not just the technical steps used to build it.
Gartner Magic Quadrant Take: What the Analysts Are Saying
If you want a more formal, industry-recognized opinion rather than classroom chatter, the power bi vs tableau gartner magic quadrant reports are worth a glance. Gartner has consistently placed both Microsoft and Salesforce, which now owns Tableau, in the Leaders quadrant for analytics and business intelligence platforms for several years running. The tableau vs power bi gartner positioning generally credits Power BI with stronger ease of use and a faster pace of feature releases, while Tableau continues to be praised for the depth and polish of its visual analytics capabilities.
What this really tells a beginner is simple. You are not choosing between a strong tool and a weak one. You are choosing between two tools that analysts worldwide consider top tier, which means your time invested in learning either one is time well spent, as long as you actually go deep enough to be genuinely useful with it rather than just familiar.
Which One Is More Popular and Which One Should You Learn First
Which is more popular power bi or tableau depends heavily on which job portal you are browsing and which city you are browsing it from. In India, Power BI listings tend to outnumber Tableau listings, largely because of how many mid-sized companies already run on Microsoft infrastructure. In global markets and in consulting-heavy roles, Tableau still holds strong demand, particularly for senior data visualization and analytics roles.
For a fresher trying to break into data analytics jobs for freshers, our honest recommendation is to start with Power BI if you come from a business, commerce, or Excel-heavy background, since the learning curve will feel gentler and you can start building a portfolio faster. If you are more design-inclined and enjoy the craft of building visually striking dashboards, Tableau might reward your patience more directly. Either way, we have written a detailed guide covering the exact Power BI developer roadmap for 2026 if you want a structured path to follow instead of guessing your next step. Once you have your basics sorted, it genuinely helps to also build a visual sense of design, and browsing our Figma training in Mumbai page can give you an idea of how design thinking strengthens the way you lay out dashboards, choose colors, and guide a viewer's eye across a report.
Building Real Projects Instead of Just Watching Tutorials
Here is something most tutorials will not tell you honestly. Watching someone else build a dashboard on YouTube does very little for your actual job readiness. What moves the needle is building your own tableau dashboards examples from scratch using messy, real world data that does not behave the way clean tutorial datasets do. If you are leaning toward Tableau specifically, we put together a practical resource on ten Tableau dashboard projects for beginners that you can actually complete and show off in interviews.
The same principle applies whether you choose power bi or tableau. Employers are far less interested in certificates and far more interested in seeing how you think when handed raw, unstructured data. A portfolio with three or four genuinely well-built dashboards, each solving a different kind of business problem, will outperform a resume that simply lists tool names without proof.
Pick projects that stretch across different domains rather than building five versions of the same sales dashboard. A retail sales tracker, a marketing campaign performance report, an HR attrition analysis, and a finance budget versus actuals dashboard together tell a hiring manager that you can adapt to whatever data lands on your desk, which is exactly what happens in a real job. Publish each project with a short write-up explaining the business question you were solving, the data source, and the decisions the dashboard was meant to support, since that context is often what separates a portfolio piece from just another pretty chart sitting on a public gallery.
How Recruiters Actually Test You in Data Analyst Interviews
It helps to know what actually happens on the other side of the table once you start applying. Most companies hiring for a data analyst role do not ask you to recite feature lists or explain what is power bi and tableau in theory. They hand you a small, often messy dataset and ask you to build something meaningful within a limited time, sometimes live during the interview and sometimes as a take-home assignment due within a day or two.
What they are quietly evaluating is rarely the tool itself. They want to see whether you clean data sensibly before visualizing it, whether you choose the right chart type for the right question instead of defaulting to a bar chart for everything, and whether you can explain your dashboard in plain business language to someone who has never opened Power BI or Tableau in their life. A candidate who builds a modest but well-reasoned dashboard and can defend every design choice will almost always beat a candidate who builds something flashy but cannot explain why a particular filter or calculation exists.
This is also where knowing data analysis using sql pays off directly, since many interviews include a short SQL round separate from the visualization test, checking whether you can join tables, aggregate data, and write clean queries before that data ever reaches a dashboard. Treat your interview preparation as a combination of three pillars, comfort with your chosen visualization tool, working SQL skills, and the ability to narrate your thought process out loud. Candidates who practice all three together consistently perform better than those who only polish their dashboards and ignore the conversation around them.
Why Structured Training Beats Self Learning for BI Tools
There is nothing wrong with self-teaching from free videos, plenty of people start that way. But data visualization tools have layers that are easy to miss without guidance, edge cases in data modeling, performance optimization on large datasets, or knowing when a particular chart type is misleading rather than clarifying. This is where structured, mentor-led learning genuinely changes outcomes.
At JustAcademy, we run live interactive sessions rather than pre-recorded content, which means you can actually ask a trainer why your DAX formula is breaking or why your Tableau calculated field is returning the wrong result, and get an answer in real time instead of searching forums for hours. Whether you choose our Mumbai classroom batches or our globally accessible online live interactive training, every course is backed by placement support, real project work, and instructors who have used these tools in actual industry settings, not just taught them theoretically. Students often ask us why they should not just rely on free business intelligence tools and free tutorials, and our answer is always the same, free resources teach you the buttons, structured training teaches you the judgment behind which buttons to press and why.
If you are also exploring adjacent skills, our Data Analytics Bootcamp in Mumbai combines SQL, Excel, Power BI, and Tableau into one job-oriented track, which is often the fastest way for a complete beginner to become interview ready rather than juggling five separate free courses that do not talk to each other.
The Bigger Picture: BI Tools List and Where the Industry Is Heading
Zooming out for a moment, Power BI and Tableau are just two names on a much longer bi tools list that includes Looker, Qlik, Sisense, Domo, and several newer graph visualization online platforms trying to carve out their own space. But in terms of hiring volume across India specifically, these two remain the dominant duo, and mastering either one, ideally alongside solid SQL fundamentals, gives you a genuinely strong foundation for a career as a data analyst.
The industry is also shifting toward AI-assisted analytics, where both Microsoft and Salesforce are rapidly embedding natural language querying and automated insight generation directly into their platforms. This means the manual, click-heavy way of building dashboards is slowly giving way to a more conversational style of data exploration. Learning the fundamentals now, rather than waiting for these tools to become even more automated, actually puts you at an advantage, because you will understand what is happening underneath the AI suggestions rather than blindly trusting them.
It is also worth remembering that no visualization tool exists in isolation inside a real company. A data analyst is usually expected to pull data from a database, clean it, model relationships between tables, and only then bring it into a database visualizer like Power BI or Tableau for the final presentation layer. Treating your learning journey as just tool training misses half the picture. Pairing your Power BI or Tableau skills with a genuine understanding of how data flows from source systems into a dashboard is what turns a tool user into someone companies actually trust with their reporting.
Conclusion
So, power bi vs tableau, which one should you actually learn in 2026? If we had to give you one honest answer, it would be this: do not treat it as a permanent, once-in-a-lifetime decision. Many working data analysts end up learning both over the course of their careers, because different employers, different industries, and different project types call for different tools. Start with the one that matches your current strengths and your target job market, build real projects, get comfortable with SQL alongside it, and let your growing confidence guide you toward the second tool later if your career path calls for it.
Whichever direction you choose, having a structured, mentor-guided path makes the entire process faster and far less frustrating than figuring it out alone through scattered videos. If you are ready to take the next step, book a free demo session with our team to see how our live interactive classes work, or download our complete course brochure to explore every Power BI and Tableau program we offer across Mumbai and online.
Power BI vs Tableau: A Feature by Feature Comparison Matrix
Pricing Talk: Power BI vs Tableau Cost Comparison for 2026
Salary Expectations: Tableau vs Power BI Professionals in India
A practical, honest walkthrough of Swift, Xcode, Windows workarounds, Flutter, React Native and the career paths that open up once you can build for Apple devices
A practical, no nonsense guide to software jobs for freshers, from picking a skill path to cracking interviews and aiming at the highest paying software engineering jobs
40 real questions and detailed answers on Kotlin, Jetpack, architecture, performance and security, so you walk into your next android technical interview ready to talk like a working developer.
From your first line of JavaScript to a react native app on the Play Store and App Store, here is the honest, practical route that beginners in India can actually follow.