I am learning flutter from JustAcademy, They provide very much great environment where people gather and work simultaneously. totally project based training institute.
MOHD ABU BAKAR ANSARI
Flutter Developer
Awesome Experience. I am a Front-end Web Designer working at Star India for 3 years now. I applied for Full-stack development and my experience has been phenomenal & they really do help with placements exceptionally. Thank you Roshan sir so much.
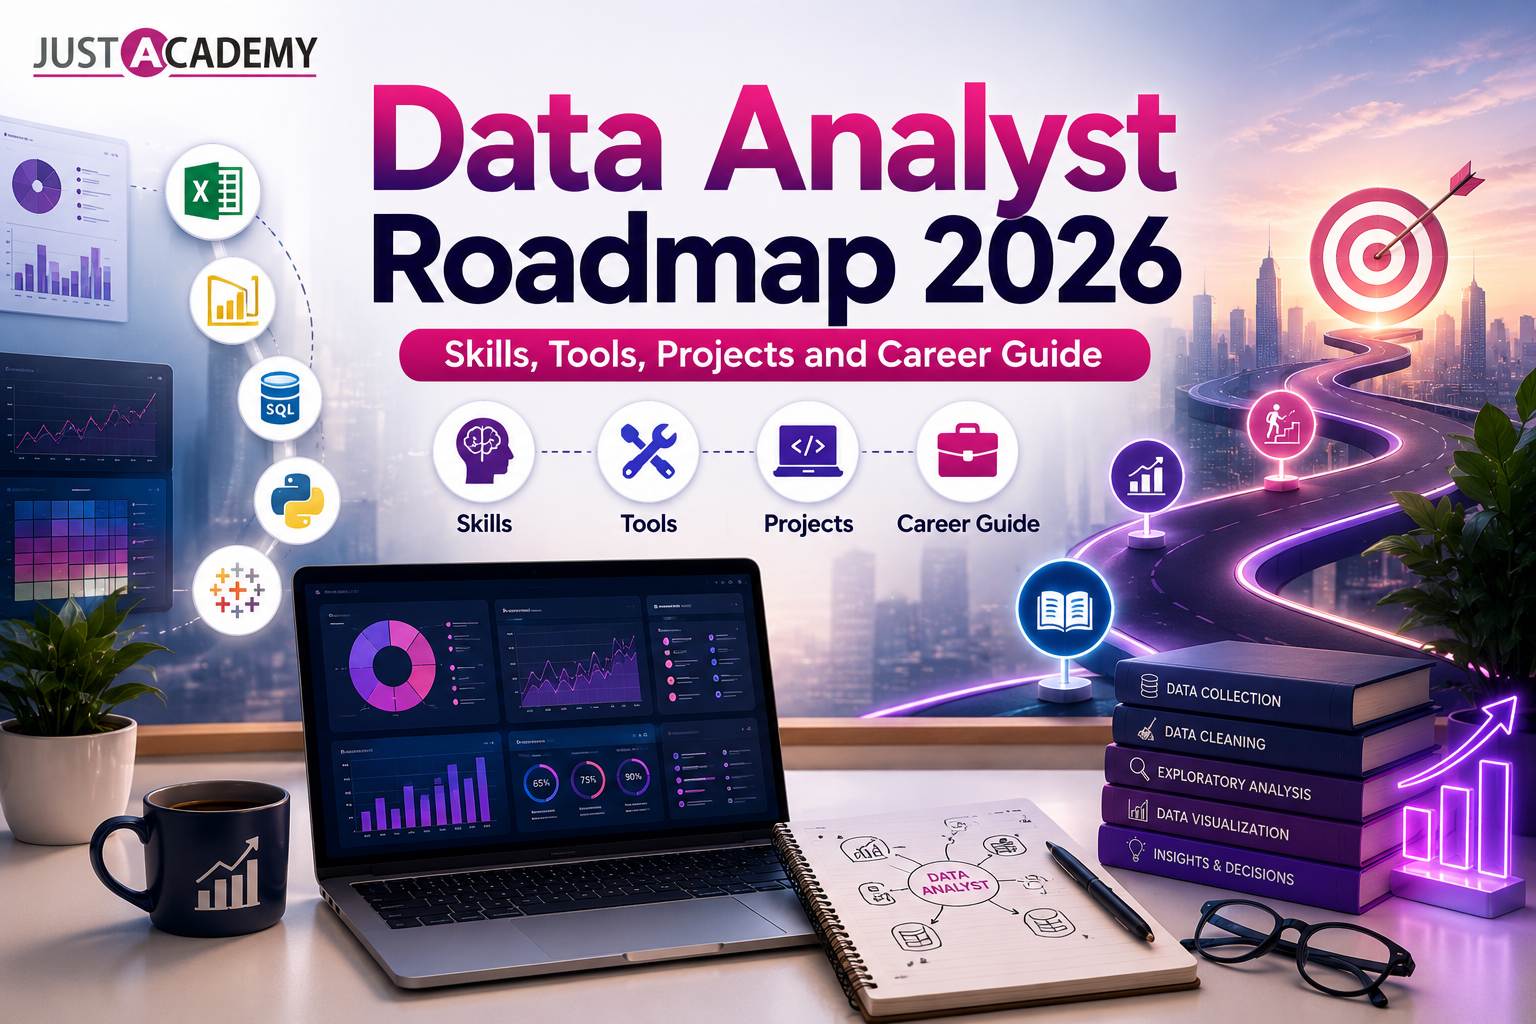
A complete beginner-to-advanced guide to the skills, software, and career path you need to break into data analytics
Every industry today runs on numbers, and somebody has to make sense of them. That somebody is a data analyst, and if you have been scrolling through job portals wondering what data analyst tools you actually need to learn before you can call yourself job ready, you are not alone. The role has quietly become one of the most in demand careers across banking, retail, healthcare, and technology, simply because companies are drowning in data and starving for people who can turn it into decisions.
This guide walks you through the entire data analysis roadmap, from the absolute basics to the advanced skills that separate a fresher from someone who gets hired within weeks of applying. If you are just starting out, you might want to look at a data analytics bootcamp that walks you through real projects instead of just theory, and if you want to test the waters first, JustAcademy also offers a free demo session so you can see how the training actually works before committing.
What This Guide Covers
By the end of this article, you will know exactly what skills needed for a data analyst role look like in 2026, which tools actually matter versus which ones are just resume filler, how the roadmap of data analyst learning is structured stage by stage, and what kind of salary and job opportunities you can realistically expect once you are ready.
Understanding the Data Analyst Role in Today's Market
Before jumping into tools and certifications, it helps to understand what the job actually involves day to day, because a lot of people enter this field with a fuzzy idea of what data analytics really means in practice.
What Does a Data Analyst Actually Do
A data analyst collects raw information from databases, spreadsheets, and business systems, cleans it up, and looks for patterns that help a company make better decisions. This could mean figuring out why sales dropped in a particular region, identifying which marketing campaign brought in the most conversions, or building a dashboard that shows leadership team performance at a glance. The work sits right at the intersection of business intelligence and analytical thinking, and it demands both technical comfort with tools and the ability to explain findings to people who have never touched a line of code.
Data interpretation is really the heart of the job. Anyone can pull numbers into a spreadsheet, but the value comes from noticing that customer churn spikes every third month, or that a particular product category underperforms only in specific cities. That kind of pattern recognition is what makes data driven decision making possible inside an organisation, and it is exactly what employers are testing for during interviews.
Data Analyst vs Data Scientist vs Business Analyst
People often confuse these three roles, so it is worth drawing a clear line. A data analyst focuses on interpreting existing data to answer specific business questions, usually through dashboards, reports, and statistical summaries. A data scientist goes a step further, building predictive models and working with machine learning to forecast future outcomes. A business analyst, meanwhile, sits closer to the business side, translating company goals into requirements and working with stakeholders rather than purely with datasets.
There is overlap between all three, especially in smaller companies where one person might wear multiple hats, but understanding this distinction helps you position yourself correctly when applying for roles. If your interest leans more toward dashboards, reporting, and business analytics tools, the data analyst path is the right starting point.
Building Blocks: Skills Needed for a Data Analyst
This is where most beginners get overwhelmed, because there is no shortage of opinions online about what to learn first. Here is a grounded breakdown of the core technical skills that actually show up in job descriptions.
SQL for Data Analysts
If there is one non negotiable skill on this list, it is SQL. Nearly every company stores its operational data in relational databases, and sql for data analyst work means being able to write queries that pull exactly the information you need, whether that is filtering customer records, joining multiple tables, or aggregating sales figures by month. Interviewers will almost always test SQL in some form, so spending real time practicing joins, subqueries, window functions, and group by statements pays off far more than memorising syntax from a cheat sheet.
The good news is that sql in data analytics does not require you to become a database administrator. You need enough fluency to extract, filter, and summarise data confidently, and that level of comfort usually comes within a few weeks of consistent practice on real datasets rather than toy examples.
Python for Data Analysts
Python has become the second pillar of modern analytics work. python for data analysts typically means using libraries like pandas for data manipulation, matplotlib or seaborn for visualisation, and sometimes numpy for numerical operations. You do not need to write complex algorithms, but you do need to be comfortable cleaning messy datasets, handling missing values, and automating repetitive reporting tasks that would otherwise eat up hours every week.
Students often ask whether Python is mandatory or whether Excel alone is enough. The honest answer is that Excel gets you in the door for smaller companies and entry level roles, but Python opens doors at larger organisations where data volumes are too big for spreadsheets to handle efficiently. JustAcademy's Python training program in Mumbai is built specifically around this kind of applied, analytics focused use case rather than generic programming theory.
Excel for Data Analysts
It might sound old fashioned, but excel for data analysts remains one of the most tested skills in interviews, particularly for entry level and fresher positions. Pivot tables, VLOOKUP and XLOOKUP, conditional formatting, and basic statistical functions are still the daily bread and butter of many analytics teams, especially in finance, operations, and small to mid sized businesses. Do not skip Excel just because it feels basic compared to Python or SQL. Recruiters use it as a quick filter to check whether a candidate has real hands on experience or only theoretical knowledge.
The Complete Data Analyst Roadmap for Beginners
Now that the core skills are clear, let us talk about sequencing, because this is where a lot of self taught learners waste months jumping between random YouTube tutorials without a structured plan. A proper data analyst roadmap for beginners generally moves through three distinct stages.
Foundation Stage
The foundation stage covers Excel basics, introductory statistics, and SQL fundamentals. This is where you learn to think in terms of rows, columns, filters, and aggregations. Most learners spend four to six weeks here, and rushing through this stage tends to create gaps that show up later when tackling more advanced projects. Basic data analysis skills like calculating averages, understanding distributions, and spotting outliers all get built during this phase.
Intermediate Stage
Once the fundamentals are solid, the intermediate stage introduces visualisation tools like Tableau or Power BI, along with deeper SQL concepts such as window functions and complex joins. This is also when Python typically enters the picture, allowing learners to automate tasks that would otherwise require repetitive manual work in spreadsheets. By the end of this stage, you should be comfortable building a dashboard from scratch using a real dataset rather than a pre cleaned sample file.
Advanced Stage
The advanced stage is about applying everything to messy, realistic business problems. This includes working with multiple interconnected datasets, presenting findings to a non technical audience, and understanding statistics deeply enough to know when a trend is meaningful versus when it is just noise. Data storytelling becomes critical here, because a brilliant analysis that nobody understands is functionally useless to a business.
If you would rather follow a guided path instead of piecing this roadmap together on your own, our detailed breakdown on how to become a data analyst in Mumbai walks through each of these stages with specific timelines and resources.
Data Analytics Softwares and Tools You Must Master
Tools are where beginners tend to get stuck comparing options endlessly instead of just picking one and starting. Here is a practical look at the analytics tools for business that actually matter in 2026.
Tableau Data Analyst Skills
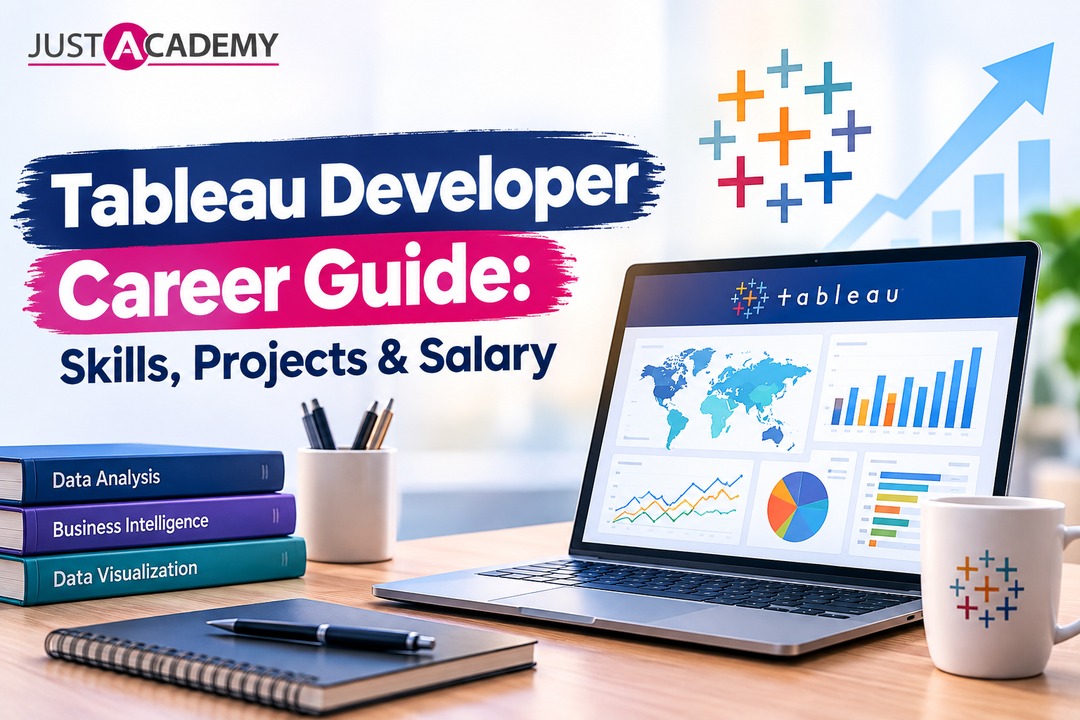
Tableau remains one of the most widely used data analysis and visualization tools in large enterprises, particularly in industries like consulting, banking, and retail analytics. It is known for its drag and drop interface that lets analysts build interactive dashboards without writing extensive code, which makes it a favourite among business teams that need visuals fast. Learning Tableau properly means understanding calculated fields, filters, parameters, and how to design dashboards that actually communicate insight rather than just displaying charts for the sake of it. JustAcademy runs a dedicated Tableau training course in Mumbai that focuses heavily on building real dashboards using business datasets.
Power BI and Business Intelligence Tools
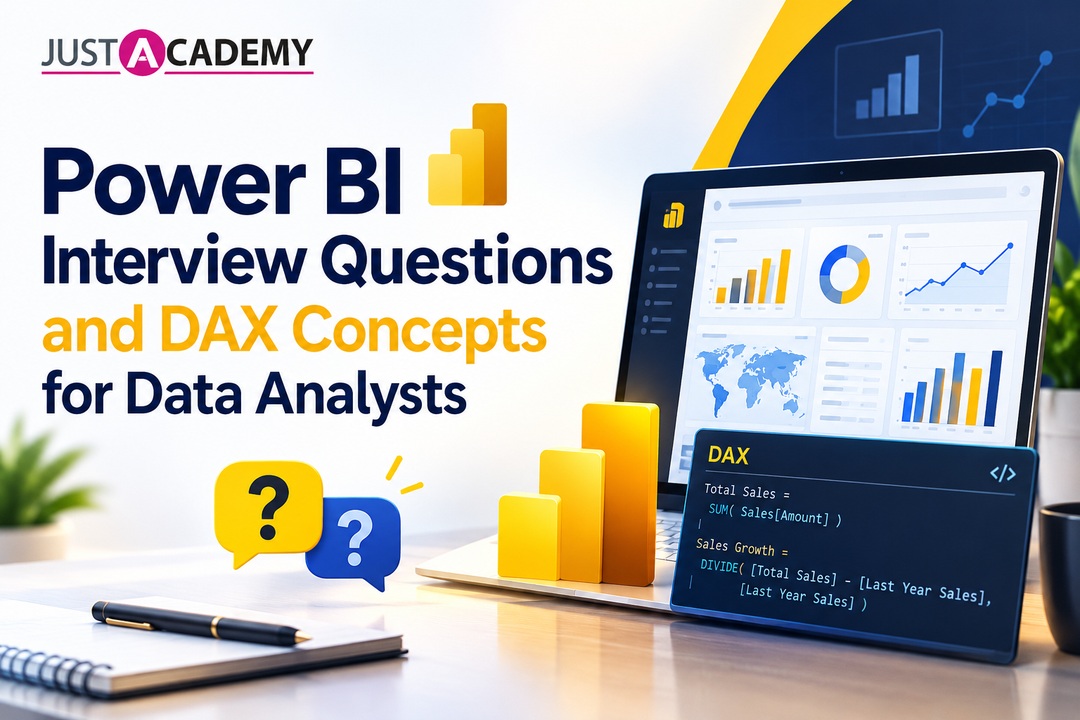
Microsoft Power BI has grown rapidly because of how tightly it integrates with tools businesses already use, particularly Excel and other Microsoft products. It is often the preferred choice in companies with existing Microsoft infrastructure, and bi business analyst roles frequently list Power BI as a required skill alongside or instead of Tableau. The learning curve is generally considered slightly gentler for those already comfortable with Excel formulas, since DAX, the formula language behind Power BI, borrows several concepts from spreadsheet functions. Our Power BI training program in Mumbai covers everything from basic report building to advanced DAX calculations used in enterprise dashboards.
A common question learners ask is which of the two to prioritise. Here is a quick side by side comparison to help you decide.
Factor
Tableau
Power BI
Ease of learning
Moderate, strong visual interface
Easier for Excel users
Cost
Higher licensing cost
More affordable, bundled with Microsoft 365 in many cases
Beyond the big two, it helps to have familiarity with additional online analytics tools depending on your target industry. Google Analytics matters if you are leaning toward marketing analytics tools and digital campaign analysis. Marketing analytics tools in general are worth exploring if you want to specialise in performance marketing data rather than general business analytics. Statistical analysis softwares like R or advanced Excel statistical add ins are useful for roles that lean heavier into research or quantitative analysis rather than pure dashboarding.
Statistics and Data Interpretation: The Analytical Backbone
Tools alone will not make you a good analyst. What separates someone who simply runs queries from someone who genuinely adds value is the ability to interpret what the numbers mean.
Statistics for Data Analysts
You do not need a graduate degree in statistics, but statistics for data analysts should include a comfortable understanding of mean, median, standard deviation, correlation, and basic probability. This foundation helps you avoid common mistakes like assuming correlation implies causation, or drawing conclusions from a sample size too small to be meaningful. Employers increasingly test candidates on these concepts during interviews, not through complex mathematical proofs, but through practical scenario questions.
Data Storytelling and Visualisation
Data storytelling is the skill of presenting findings in a way that non technical stakeholders can immediately understand and act on. This means choosing the right chart type for the right message, avoiding cluttered dashboards, and structuring a presentation so the key insight comes first rather than being buried under ten slides of raw numbers. Visualisation, in this sense, is not decoration. It is communication, and analysts who master it tend to get promoted faster because their work directly influences business decisions rather than sitting unread in a shared folder.
Qualifications and Career Requirements
A lot of aspiring analysts worry excessively about formal qualifications, so let us set realistic expectations here.
Data Analytics Qualifications That Actually Matter
Data analytics qualifications in the real hiring market tend to matter less than demonstrated skill. A degree in commerce, engineering, statistics, or even an unrelated field is perfectly fine as long as you can show practical competence through projects and a solid understanding of the tools discussed above. That said, qualifications for data analyst roles at larger corporations sometimes do specify a bachelor's degree as a baseline filter, so it is worth checking specific job listings in your target companies.
Data Analyst Job Requirements for Freshers
Data analyst job requirements for entry level candidates generally include working knowledge of Excel and SQL, basic familiarity with at least one visualisation tool, and the ability to explain a project you have worked on clearly during an interview. Skills required for data analyst fresher roles rarely include advanced machine learning or deep statistical modelling, those come later. What matters most at this stage is proving you can take a messy dataset and turn it into something useful, even on a small scale.
Data analyst coding requirements are also often overstated. You need enough coding comfort to write SQL queries and basic Python scripts, but you are not expected to build complex software applications. This is a common source of anxiety for career switchers who assume they need years of programming experience before applying, when in reality a focused few months of practice is usually sufficient.
Real World Data Analyst Projects to Build Your Portfolio
Recruiters see hundreds of resumes listing the same generic skills. What actually catches attention is a portfolio of data analyst projects that show applied thinking rather than textbook exercises.
Start with something you can personally source, like analysing your city's public transport data, or building a dashboard around retail sales trends using a publicly available dataset. From there, move toward projects that mimic real business questions, such as identifying which customer segments are most likely to churn, or building an interactive sales performance dashboard broken down by region and product category. The goal is not complexity for its own sake. A well explained, moderately complex project with clear business reasoning behind every step will always beat an overly technical project that nobody, including the candidate, can properly explain in an interview.
Documenting your thought process matters just as much as the technical execution. When you present a project, walk through why you chose a particular approach, what the data told you, and what business action would follow from your findings. This is exactly the kind of analytical thinking interviewers are trying to evaluate.
A question worth asking before you start any project is what story the dataset can realistically tell. Beginners often pick datasets that look impressive but are too shallow to support any real conclusion, which leaves the final dashboard looking polished but empty of insight. A smaller dataset that you can genuinely interrogate, where you can explain every column and every anomaly, will always make for a stronger portfolio piece than a massive dataset you barely understand. Aim for two to three finished projects rather than ten half done ones. Depth beats volume every time in a portfolio review, and a recruiter scanning your GitHub or portfolio site will spend far more time on one well documented case study than on a long list of incomplete notebooks.
Common Mistakes Beginners Make on the Data Analyst Roadmap
Even with a clear roadmap, it is easy to fall into habits that slow progress without you realising it. Knowing these pitfalls in advance can save you months.
Learning Tools Without Learning the Business Context
A frequent mistake is treating tools as the end goal rather than the means to an end. Someone can be technically fluent in Tableau or Power BI and still struggle in interviews because they cannot explain why a particular metric matters to a business. Every tool you learn should be paired with practice on interpreting what the output actually means for a company, not just how to produce a chart that looks correct.
Skipping SQL Because Python Feels More Exciting
Because Python gets more attention online, some beginners rush through SQL or skip it almost entirely, assuming Python alone will cover everything. In practice, the opposite is usually true. Most data analyst job requirements list SQL before Python, simply because that is where the data actually lives in most companies. Underinvesting in SQL is one of the most common reasons candidates struggle in technical interviews.
Comparing Progress to Others Instead of Following a Plan
Online forums are full of people claiming they became job ready in a few weeks, which can make a steady, structured pace feel too slow by comparison. In reality, most successful analysts spent three to six months building genuine competence, not a handful of weeks. Comparing your timeline to unverifiable claims online usually leads to rushed, shallow learning rather than the depth employers are actually screening for.
Career Growth After Your First Data Analyst Role
Landing the first job is only the starting point. It helps to know where the role can lead so you can plan your learning with the next two or three years in mind, not just the immediate job search.
Moving Into Senior Analyst or BI Specialist Roles
After a couple of years of solid experience, many analysts move into senior analyst or business intelligence specialist positions, where the focus shifts from executing individual reports to owning entire reporting systems, mentoring newer analysts, and working more directly with leadership on strategic decisions. This transition usually rewards analysts who have developed strong data storytelling skills alongside their technical ability, since senior roles depend heavily on communicating insight clearly to decision makers.
Transitioning Toward Data Science or Analytics Engineering
For analysts who enjoy the more technical side of the work, the natural next step is often a move toward data science, which builds on existing SQL and Python skills but adds predictive modelling and machine learning into the mix. Others prefer analytics engineering, which focuses on building and maintaining the data pipelines that feed dashboards and reports in the first place. Both paths are realistic extensions of the data analyst roadmap rather than entirely separate careers, which is part of why starting with a strong analytics foundation pays off well beyond the first job.
Data Analyst Jobs, Salary and Career Growth in India
Once the skills and portfolio are in place, the natural next question is what the job market and compensation actually look like.
Data Analyst Salary in India
Data analyst salary in India varies significantly based on city, company size, and experience level, but entry level roles in major metros typically start in a reasonable range that grows steadily with two to three years of hands on experience, particularly for those comfortable with both SQL and a visualisation tool. Mumbai, given its concentration of banking, finance, and consulting firms, tends to offer competitive packages for analysts who can demonstrate strong business intelligence skills alongside technical ability. If you are curious about specific numbers and current market trends in the city, our detailed piece on whether data analytics is a good career in 2026 with salary and job opportunities in Mumbai breaks this down further.
Top Data Analytics Companies Hiring
Top data analytics companies span banking and financial services, ecommerce, consulting firms, and increasingly, healthcare and logistics as those industries digitise their operations. Data analyst jobs in India have grown steadily as more mid sized companies, not just large enterprises, begin building in house analytics teams rather than outsourcing reporting work. This broadening of demand is good news for newcomers, since it means opportunities are not limited to a handful of large tech companies but spread across sectors that were traditionally slower to adopt data driven decision making.
How to Become a Data Analyst With No Experience
This is probably the most common question from career switchers, and the honest answer is that it is entirely achievable with a focused plan rather than a scattered one. How can I become a data analyst without prior experience usually gets answered the same way regardless of background: build the core skills in order, complete two to three solid projects that mimic real business scenarios, and be ready to clearly articulate your analytical reasoning in interviews.
How to become a data analyst with no experience often comes down to leveraging transferable skills from your current field. Someone coming from finance already understands business metrics. Someone from marketing already understands campaign performance. Someone from operations already understands process bottlenecks. The technical tools are learnable within months, but that existing business context often gives career switchers an edge over fresh graduates who know the tools but not the business problems those tools are meant to solve.
Why Structured Training Makes the Difference
Self teaching is absolutely possible, but it usually takes significantly longer and involves a lot of trial and error that structured training simply removes. A well designed data analytics bootcamp or course compresses months of scattered learning into a focused curriculum, backed by live interactive sessions where you can actually ask questions in real time instead of getting stuck on a tutorial video with no way to clarify doubts.
JustAcademy has built its reputation as the best course in Mumbai for exactly this reason, combining live interactive training with real world projects rather than pre recorded content alone. Whether you choose to attend in person at the Mumbai or Pune branches or join through live interactive sessions online from anywhere in the world, the structure remains the same: hands on projects, direct mentor access, and placement support that helps bridge the gap between finishing a course and actually landing your first analytics role. This ISO certified approach to training means the curriculum stays aligned with what companies are actually hiring for, rather than teaching outdated tools that look good on paper but rarely come up in real interviews.
For those still comparing options, it helps to see the full curriculum and course structure directly rather than relying on secondhand summaries, which is why booking a free demo session before enrolling is genuinely worth the half hour it takes.
Conclusion
Becoming a data analyst in 2026 is less about chasing every trending tool and more about building a solid, sequential foundation: SQL and Excel first, visualisation tools like Tableau and Power BI next, Python and statistics to round things out, and real projects throughout to prove you can apply all of it to genuine business problems. The roadmap is not complicated, but it does require consistency and the right guidance to avoid wasting months on scattered, unstructured learning.
If you are ready to move from reading about this roadmap to actually walking through it with expert guidance, book a free demo session with JustAcademy today, or download our detailed course brochure to explore the full curriculum, project list, and placement support available across our Mumbai, Pune, and global online programs.
The Complete Data Analyst Roadmap for Beginners
Data Analytics Softwares and Tools You Must Master
Data Analyst Jobs, Salary and Career Growth in India
A practical, honest walkthrough of Swift, Xcode, Windows workarounds, Flutter, React Native and the career paths that open up once you can build for Apple devices
A practical, no nonsense guide to software jobs for freshers, from picking a skill path to cracking interviews and aiming at the highest paying software engineering jobs
40 real questions and detailed answers on Kotlin, Jetpack, architecture, performance and security, so you walk into your next android technical interview ready to talk like a working developer.
From your first line of JavaScript to a react native app on the Play Store and App Store, here is the honest, practical route that beginners in India can actually follow.