I am learning flutter from JustAcademy, They provide very much great environment where people gather and work simultaneously. totally project based training institute.
MOHD ABU BAKAR ANSARI
Flutter Developer
Awesome Experience. I am a Front-end Web Designer working at Star India for 3 years now. I applied for Full-stack development and my experience has been phenomenal & they really do help with placements exceptionally. Thank you Roshan sir so much.
Devesh Chaturvedi
Full-Stack Development
21 May, 2026
Your Complete Guide to Cracking Power BI Questions on Dashboard, DAX, and Data Modeling
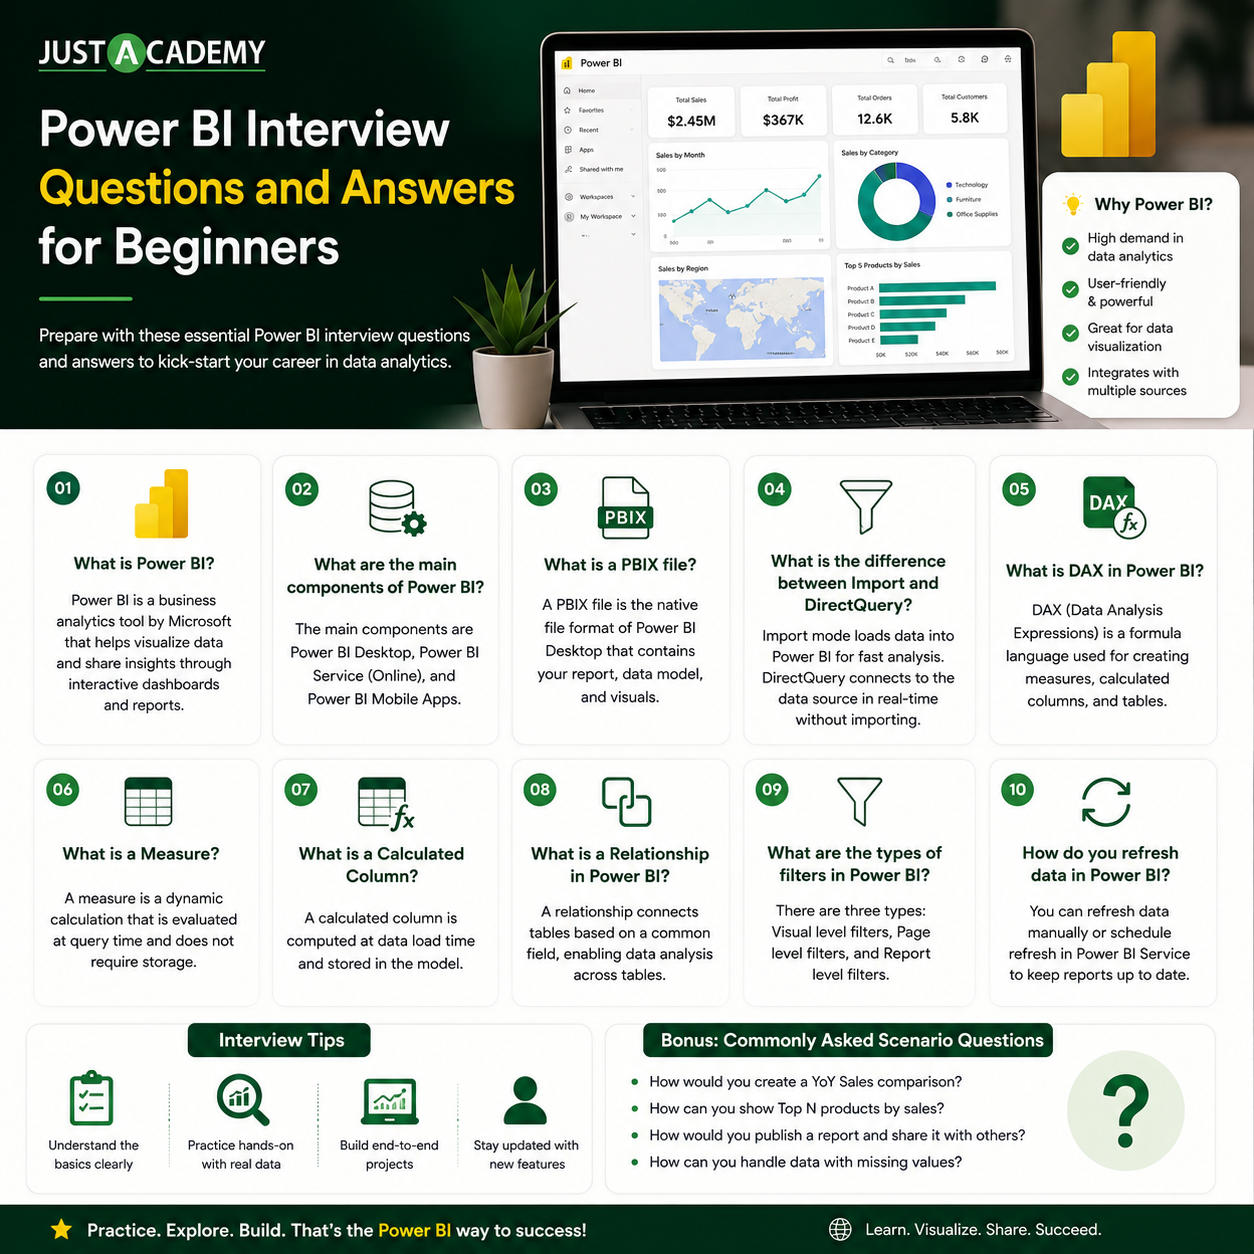
Power BI Interview Questions and Answers for Beginners
Power BI has become one of the most in-demand business intelligence tools in the industry today. Companies across every sector are actively hiring professionals who can build interactive dashboards, transform raw data into meaningful insights, and support data-driven decision making. If you are preparing for a data analyst or business intelligence role, cracking the Power BI interview is a critical step.
This blog covers the most important power bi interview questions and answers for beginners. Whether you are a fresh graduate, a career switcher, or someone looking to validate their skills before an interview, this guide will help you prepare with confidence.
What is Power BI and Why Does It Matter
Understanding Power BI
Power BI is a business analytics service developed by Microsoft. It allows users to connect to hundreds of data sources, clean and transform data, build reports, and share interactive dashboards across an organization. It is part of the Microsoft Power Platform and integrates seamlessly with tools like Excel, Azure, SharePoint, and Teams.
Why Employers Ask Power BI Questions
Organizations use Power BI to eliminate manual reporting, reduce dependency on IT for data access, and empower business teams to make faster decisions. As a result, roles such as Data Analyst, Business Intelligence Developer, Reporting Analyst, and even Business Analyst now list Power BI as a core requirement. Knowing the right answers to Power BI questions gives you a strong edge in the hiring process.
Core Power BI Interview Questions for Freshers
What are the main components of Power BI?
Power BI is made up of several core components that work together:
Component
Description
Power BI Desktop
A Windows application used to create reports and data models
Power BI Service
A cloud-based platform (app.powerbi.com) for publishing and sharing
Power BI Mobile
Apps for iOS and Android to view reports on the go
Power BI Gateway
A bridge that connects on-premises data sources to the cloud
Power BI Report Server
An on-premises server for organizations that cannot use the cloud
What is the difference between Power BI Desktop and Power BI Service?
Power BI Desktop is used for building and designing reports. It is a free downloadable application installed on a local machine. Power BI Service is the online platform where reports are published, shared, and scheduled for refresh. You create in Desktop and collaborate in Service.
What is a dataset in Power BI?
A dataset is a collection of data imported or connected to Power BI. It can come from Excel, SQL Server, web APIs, SharePoint, or cloud services. A single dataset can power multiple reports and dashboards.
What is DAX?
DAX stands for Data Analysis Expressions. It is the formula language used in Power BI to create calculated columns, measures, and tables. DAX is similar in syntax to Excel formulas but is designed for relational data models and aggregations over large datasets. It is one of the most frequently tested areas in power bi interview questions for freshers.
Example of a basic DAX measure:
Total Sales = SUM(Sales[Amount])
What is Power Query?
Power Query is the data transformation engine in Power BI. It uses a visual interface called the Query Editor and a language called M to clean, reshape, and prepare data before loading it into the data model. Tasks like removing duplicates, splitting columns, changing data types, merging tables, and appending rows are all handled in Power Query.
What is the difference between a measure and a calculated column?
Feature
Measure
Calculated Column
Calculated at
Query/visual runtime
Data refresh/load time
Stored in
Memory
Data model table
Use case
Aggregations, KPIs
Row-level attributes
Affects file size
No
Yes
What is a relationship in Power BI?
A relationship is a logical connection between two tables based on a common column. Relationships enable cross-filtering and allow DAX to aggregate data across related tables. Power BI supports one-to-one, one-to-many, and many-to-many relationships.
What is a Star Schema?
A star schema is a data modeling pattern where a central fact table is surrounded by dimension tables. The fact table contains measurable data (like sales amounts or order quantities) and the dimension tables contain descriptive attributes (like product names, customer details, or date information). Star schemas are recommended in Power BI for performance and simplicity.
Dashboard Interview Questions You Should Know
What is the difference between a report and a dashboard in Power BI?
A report is a multi-page document with visualizations built from a single dataset. A dashboard is a single-page canvas that can pin visuals from multiple reports and datasets. Dashboards in Power BI Service support real-time data tiles and are primarily used for monitoring key metrics at a glance.
What types of visualizations are available in Power BI?
Power BI offers a wide range of built-in visualizations including bar charts, line charts, pie charts, donut charts, scatter plots, treemaps, maps, waterfall charts, funnel charts, gauges, KPI cards, and tables. Additionally, custom visuals can be imported from the Power BI AppSource marketplace.
What is a slicer in Power BI?
A slicer is an on-canvas filtering visual that allows report viewers to filter data by selecting values such as a date range, product category, or region. Slicers make dashboards interactive without requiring users to use the filter pane.
What is Row Level Security?
Row Level Security (RLS) is a feature in Power BI that restricts data access at the row level for different users. For example, a sales manager in Mumbai should only see data for the Mumbai region while a national manager sees all regions. RLS is configured using DAX filter rules and managed roles in Power BI Desktop, then published and assigned in the Power BI Service.
What is the difference between Import mode and DirectQuery mode?
Mode
Description
Best For
Import
Data is loaded into Power BI's in-memory engine
Faster performance, offline use
DirectQuery
Queries are sent live to the source database
Large datasets, real-time data
Live Connection
Read-only live connection to Analysis Services
Enterprise BI setups
Intermediate Power BI Questions for Freshers
What is the CALCULATE function in DAX?
CALCULATE is one of the most powerful and commonly used functions in DAX. It evaluates an expression in a modified filter context. It allows you to override existing filters or apply new ones dynamically.
Example: Sales in 2023 = CALCULATE(SUM(Sales[Amount]), Sales[Year] = 2023)
What are filters in Power BI?
Power BI has three levels of filters. Visual-level filters apply to a single chart. Page-level filters apply to all visuals on one report page. Report-level filters apply across all pages of the report. There are also drillthrough filters and report URL filters for advanced use cases.
What is a gateway in Power BI?
A Power BI Gateway is software installed on a local machine or server that acts as a bridge between the Power BI Service in the cloud and on-premises data sources like SQL Server, Oracle, or local Excel files. It enables scheduled data refresh without exposing the source system to the internet directly.
What is the difference between SUM and SUMX?
SUM aggregates a single column directly. SUMX is an iterator function that evaluates an expression row by row and then aggregates the result. SUMX is useful when you need to calculate a value per row before summing.
Example: Total Revenue = SUMX(Sales, Sales[Quantity] * Sales[UnitPrice])
What is bookmarking in Power BI?
Bookmarks capture the current state of a report page, including filter selections, slicer values, and visual visibility. They are used to create navigation buttons, storytelling flows, and toggle effects within reports.
Advanced Power BI Questions for Interviews
What is incremental refresh?
Incremental refresh is a feature in Power BI Premium and Premium Per User that allows only new or changed data to be refreshed rather than reloading the entire dataset. This significantly reduces refresh times and resource consumption for large datasets.
What are aggregations in Power BI?
Aggregations allow Power BI to use a pre-summarized table for fast query responses while still falling back to the detailed data when needed. This technique is used to handle very large datasets efficiently without full DirectQuery performance overhead.
What is the USERELATIONSHIP function?
USERELATIONSHIP is a DAX function used to activate an inactive relationship between two tables for the duration of a calculation. Power BI only allows one active relationship between two tables, so inactive relationships can be leveraged with this function for scenarios like comparing order date versus ship date.
What is the difference between RELATED and LOOKUPVALUE?
RELATED retrieves a value from a related table using an existing active relationship. LOOKUPVALUE retrieves a value from a table based on specified search conditions without needing a relationship. RELATED is more efficient when a relationship exists; LOOKUPVALUE is used as a workaround when one does not.
Tips to Prepare for Power BI Interviews
Practice with Real Datasets
Theoretical knowledge alone is not enough. Practice building reports using publicly available datasets from sources like Kaggle or the Microsoft sample databases. Recreate common business scenarios such as sales dashboards, HR analytics reports, and financial summaries.
Understand Business Context
Interviewers often ask how you would solve a real business problem using Power BI. Understand concepts like KPI tracking, budget versus actual analysis, cohort analysis, and time intelligence functions such as SAMEPERIODLASTYEAR, DATEADD, and TOTALYTD.
Be Ready for Live Demonstrations
Many companies ask candidates to build a small report or solve a DAX challenge on the spot during technical rounds. Practice creating measures, setting up relationships, and building visuals quickly in Power BI Desktop.
Focus on These Key Topics
Data modeling and relationships
DAX functions especially CALCULATE, FILTER, ALL, RELATED, and iterators
Power Query transformations
Row Level Security setup
Report publishing and workspace management in Power BI Service
Performance optimization techniques
Why Take a Structured Power BI Course
Self-study is valuable but a structured course gives you a guided learning path, hands-on projects, doubt resolution sessions, and placement support. If you are based in Maharashtra or prefer in-person or live online training, enrolling in the best Power BI course in Mumbai is a smart investment in your career.
JustAcademy's Microsoft Power BI Training in Mumbai is designed for beginners and working professionals. The curriculum covers Power Query, DAX, data modeling, report design, Power BI Service, and real-world projects that prepare you for actual job requirements.
Related Courses to Build a Complete Data and Tech Profile
Expanding your skill set beyond Power BI makes you a more versatile and hireable professional. Here are related training programs worth exploring:
Preparing for Power BI interviews requires a combination of conceptual clarity, hands-on practice, and familiarity with real-world use cases. This guide has covered the most important power bi interview questions ranging from basic definitions to advanced DAX and dashboard design concepts. Whether you are a fresher appearing for your first analytics role or an experienced professional looking to switch into business intelligence, mastering these topics will give you a significant advantage.
The demand for Power BI professionals in India, especially in cities like Mumbai, is growing rapidly. Companies are investing in data infrastructure and need analysts who can turn data into decisions quickly. The time to build these skills is now.