User Experience Metrics for iOS Applications
Enhancing User Experience: Key Metrics for iOS Applications
User Experience Metrics for iOS Applications
User experience (UX) metrics for iOS applications are critical measurements that help developers and designers assess the usability and overall satisfaction of their app among users. Key metrics include task success rate, which measures how effectively users can complete tasks; time on task, which reflects how long users take to accomplish specific activities; user error rates, indicating mistakes made during interaction; and user satisfaction ratings, usually gathered through surveys or feedback forms. Other important metrics include Net Promoter Score (NPS) to gauge customer loyalty, retention rates to evaluate how well the app keeps users coming back, and engagement metrics such as session length and frequency of use. By analyzing these metrics, developers can identify pain points, optimize the interface, improve functionalities, and ultimately enhance the overall user experience of their iOS applications.
To Download Our Brochure: https://www.justacademy.co/download-brochure-for-free
Message us for more information: +91 9987184296
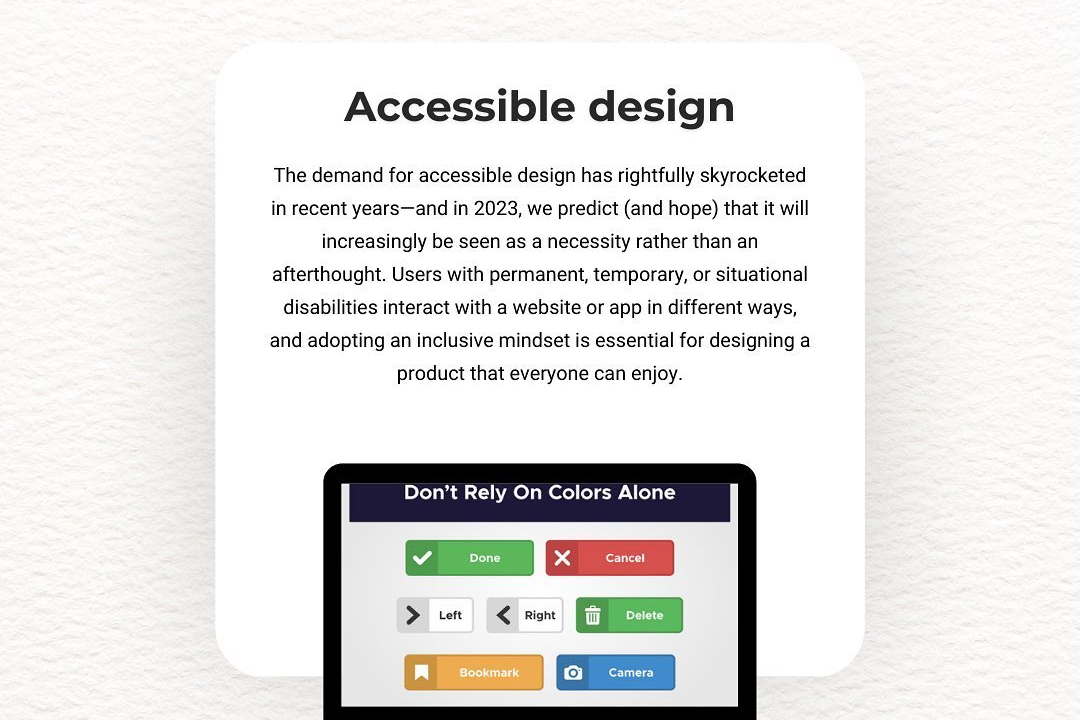
1 - Usability: This metric measures how easy and intuitive an app is to use. It includes factors like the learning curve, efficiency of use, and user satisfaction.
2) Engagement: Engagement metrics assess how often and how long users interact with the app. This includes session length and frequency of use, which reflect the app's ability to retain user interest.
3) Retention Rate: This measures the percentage of users who return to the app after their first use. A high retention rate indicates the app's value and user satisfaction over time.
4) Churn Rate: Complementary to retention, the churn rate tracks the percentage of users who stop using the app within a certain time frame, offering insights into potential issues with user experience.
5) Task Success Rate: This metric monitors the percentage of users who successfully complete a specific task within the app, indicating how effectively the app supports its intended use cases.
6) Error Rate: This measures the frequency of user errors during interactions, which can indicate confusing design elements or usability issues in the app.
7) Time on Task: This measures how long it takes for users to complete specific tasks within the app. Shorter times may indicate a more intuitive user experience.
8) Net Promoter Score (NPS): A widely used metric to gauge customer loyalty, NPS assesses the likelihood of users recommending the app to others, reflecting overall satisfaction.
9) Customer Satisfaction Score (CSAT): This metric surveys users immediately after an interaction or experience within the app, helping to gauge satisfaction levels.
10) App Store Ratings and Reviews: User ratings and qualitative feedback in the App Store provide invaluable insights into user sentiment and areas for improvement.
11) Conversion Rate: For apps with specific goals (like purchasing or signing up), the conversion rate tracks how many users complete these desired actions.
12) Onboarding Completion Rate: This measures the percentage of users who complete the onboarding process, which can indicate how effectively the app introduces its features.
13) Heatmaps: Heatmaps provide visual representations of user interactions, showing which areas of the screen are most frequently tapped, helping identify intuitive and confusing parts of the UI.
14) Crash Rate: Monitoring the frequency of app crashes can reveal technical issues that significantly impact user experience and satisfaction.
15) User Feedback Analysis: Collecting and analyzing qualitative feedback through surveys or forums provides depth to understand user pain points and delights.
16) User Journey Mapping: Tracking the paths users take through the app helps identify bottlenecks and friction points in the user experience.
17) Session Interruption Rate: This metric tracks how often users interrupt their session (e.g., exiting the app), indicating potential issues with engagement or satisfaction.
Incorporating these metrics into a training program can help students understand the importance of designing with a user centric approach and implementing strategies to improve user experience in iOS applications.
Browse our course links : https://www.justacademy.co/all-courses
To Join our FREE DEMO Session: Click Here
Contact Us for more info:
- Message us on Whatsapp: +91 9987184296
- Email id: info@justacademy.co
Exploring JOB ROLES in android development